Gas Is Here To Stay
Ten years ago, renewables accounted for eight percent of the energy mix in New England. After a decade of progress and innovation, the renewable energy mix only grew three percent; accounting for 11 percent of the energy mix in New England.
Why does this matter? Deploying renewables is part of the comprehensive path to reducing carbon emissions. However, we must ensure we are prepared for the present while innovating for the future. The pie charts below from ISO New England showcase the importance of a diverse energy portfolio.
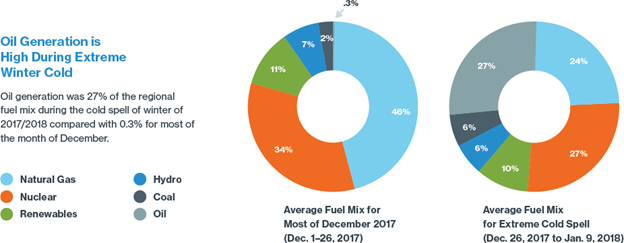
The pie chart on the left shows the average energy generation in New England on a given day in December. The pie chart on the right is the energy mix used during extreme cold spells when demand is higher than normal. There are several differences between the energy mix on an average New England day and the mix during a cold spell.
First, oil. On normal days, oil accounts for 0.3 percent of the energy mix. When demand for energy is higher than normal, oil use spikes to a whopping 27 percent of the energy mix. Coal usage triples from two percent in normal times to six percent when winter weather becomes excessively cold.
Coal and oil produce more emissions than natural gas. According to the Energy Information Administration, natural gas produces .91 pounds of CO2 emissions per kWh while coal produces 2.23 pounds/kWh and oil 2.13 pounds/kWh. This means natural gas produces at least 1.22 pounds less of CO2 emissions per kWh than the CO2-emitting alternatives. When demand is higher than normal and the percentage of natural gas in the energy mix drops in favor of coal and oil, CO2 emissions jump dramatically.
Why does the percentage of natural gas in the energy mix drop when demand is high? Simple: the infrastructure to transport the gas to New Englanders who need it isn’t there. There just isn’t enough pipeline capacity to bring gas from wellhead to burner tip. New England has tried to get around this by buying cargos of liquid natural gas that are delivered on ships. Capacity is limited at those import terminals even when New England isn’t competing with European countries for natural gas. (To stay up to date on natural gas supply, demand, storage and pricing email Adam Kay at akay@aga.org to subscribe to our biweekly release of Natural Gas Market Indicators.)
How do we solve this? Despite a decade of development, renewables are not as commercially viable and therefore not deployed to a scale that could match demand. The region’s lack of natural gas infrastructure has led to an overreliance on coal and oil, a leap backward from the goal of a lower emissions future.
New England needs more natural gas pipelines to ensure supply can meet demand and prepare for a future that will include more hydrogen and renewable natural gas. Building the infrastructure to transport both natural gas and other innovative fuels will create a critical force for reducing greenhouse gas emissions and meeting the needs of customers and communities in the region.
Increasing the direct use of natural gas is another effective way to lower overall demand. Direct use of gas is 91 percent efficient, whereas converting it to electricity (power burn) is only 36 percent efficient. Electricity demand can be lowered further through more efficient appliances and natural gas heat pumps recently hitting the market. These appliances can be 140 percent efficient – and, unlike electric heat pumps, they still work when the temperature is below -20 degrees.
Natural gas has been and will continue to be, critical for reducing U.S. greenhouse gas emissions. The gas distribution system remains one of the best tools available to lower emissions. Renewable energy sources currently remain marginal contributors to the energy mix, and while we wait for their further commercialization, we must pursue infrastructure opportunities to get available natural gas to New Englanders.