Here’s What Makes Up Your Natural Gas Bill

Households across America continue to feel the strain of inflation on purchases ranging from grocery bills to home prices. Despite these pressures, natural gas prices remain near historic inflation-adjusted lows. However, some customers are still experiencing increased energy bills. What’s driving these localized increases, and what can be done about them?
The price you see on your natural gas bill is influenced primarily by three different factors – the amount of natural gas you use (and the weather that causes you to crank up the thermostat), changes in commodity pricing and changes in government and regulatory policies.
On average, natural gas utility bills have stayed relatively low and consistent with recent years. Natural gas commodity prices today are 47% lower than they were before the Shale Revolution unlocked massive domestic supplies. The chart below shows how the typical natural gas utility bill today compares to previous years.
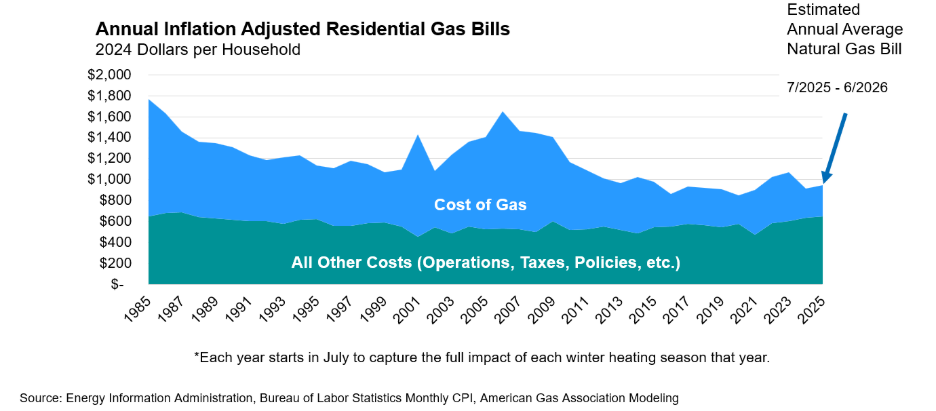
Natural gas doesn’t just cost less today – it’s used more efficiently. The average natural gas home now consumes far less fuel for the same applications as in previous decades. Utilities have also reduced leaks by more than 70% since 1990, further cutting fuel costs. As a result, natural gas now accounts for a much smaller share of total bills than it once did.
This winter’s weather patterns suggest a colder than average winter for much of the United States. If you’re seeing higher energy bills than you expected this winter, examining the efficiency of your home and taking steps to weatherize may help reduce your natural gas consumption and keep bills down. We’ve got advice on easy steps you can take, and we recommend reaching out to your utility to see what weatherization programs may be available to you locally.
But what about the rest of the costs on your bill?
It’s helpful to visualize how utilities and regulators categorize expenses. The dollar bill below represents an average natural gas utility bill in America.
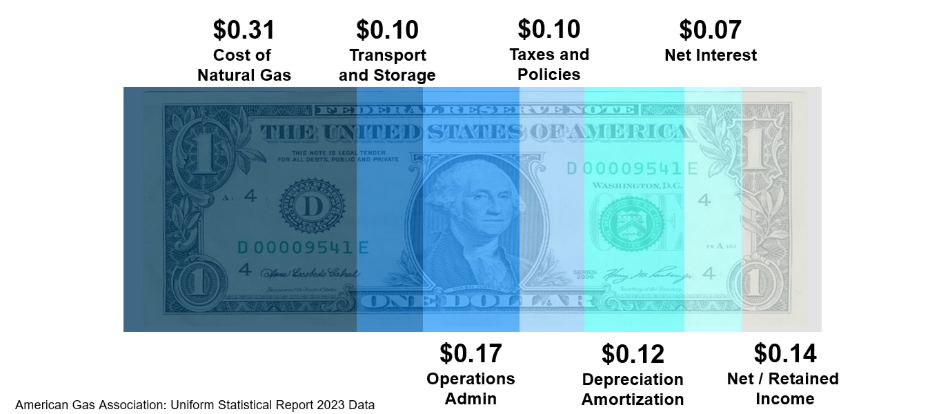
The typical natural gas bill has several components, all of which contribute to how natural gas is delivered to a home or business. There are costs related to the commodity price of the fuel itself, transporting and storing natural gas, accounting for infrastructure investments, administrative costs, and taxes. Let’s break it down.
Nationwide, an average of 31% of your bill covers the natural gas fuel itself that heats your home and cooks your meals.
Another contributor is taxes and government policies. These vary widely by state. In some, they are minimal; in others, they represent a larger share. These funds can support programs that help customers weatherize their homes or meet state decarbonization mandates. Taxes are also significant, as utilities own land, facilities and equipment, and employ large workforces. On average, taxes and policy costs account for about 10% of the bill—but in some states they can exceed 40%.
The next bucket is infrastructure. The nation’s 2.4 million miles of natural gas pipelines, along with related storage and delivery facilities, ensure reliability during peak demand. Maintaining, modernizing, and continual improvement of this infrastructure accounts for about 10% of the typical bill. Utility rates are structured to gradually pay off infrastructure over decades, with a further 12% of the typical bill going towards the depreciation and amortization of those assets.
The people who operate the natural gas delivery system are as indispensable as the physical infrastructure they operate. The operations and administration portion of the bill supports the skilled workforce that safely and efficiently operates and maintains the system. Nationwide, 17% of what you pay goes towards operations and administration.
Any system this large and complex requires a vast amount of capital investment to run. Utilities are often authorized to borrow money to pay for necessary improvements that maintain the quality of service for their customers. Borrowing money requires paying interest, which accounts for a further 7% of the typical bill.
Finally, investors in natural gas utilities are provided the opportunity to earn a fair and reasonable return on their investment, which is necessary to attract investors and keep the natural gas systems safe, modern and reliable. State regulators set an allowed return on equity that utilities may earn on the portion of investment financed by shareholders, and this return is built into the cost of providing service. Currently, the average allowed return is about 7% in the United States.
Utility commissions regulate the net income a natural gas utility is allowed to make in exchange for providing their services. The national average revenue for natural gas utilities is currently around 14%. This figure represents the accounting result after paying all operating expenses, interest and taxes, and can fluctuate due to changes in costs, usage and the timing of rate cases. Much of these earnings are directly reinvested in the natural gas system to maintain and upgrade infrastructure that delivers essential natural gas to homes and businesses.
Utilities work hard to keep all costs down. They acquire much of their natural gas months in advance, using financial instruments and storage to help ensure supply reliability and to minimize the need to pay higher prices on the spot market when demand spikes. Leading practices for minimizing the cost of system improvements are shared across the industry, and maximizing workforce efficiency is a priority for all natural gas utilities. However, taxes and government policies are controlled by state legislators and regulators. Regularly reviewing how policy costs affect affordability can help identify solutions that keep energy within reach for everyone.