Energy Insights: Peak Daily Domestic Demand for Natural Gas and Electricity
The natural gas system delivered 3.1 times as much domestic energy this winter as the electric grid during peak conditions.
- The natural gas system set a record for total daily domestic demand of 157.3 bcf on 12/24/2022. This was a significant increase over the record previously set on 1/1/2018 when total daily demand reached 149.3 bcf.
- The typical peak natural gas and electricity demand days take place in January and July +/- 15 days.
- Domestic demand only includes power generation, residential, commercial, and industrial end users. Additional natural gas supplied through LNG and Mexican exports were not included.
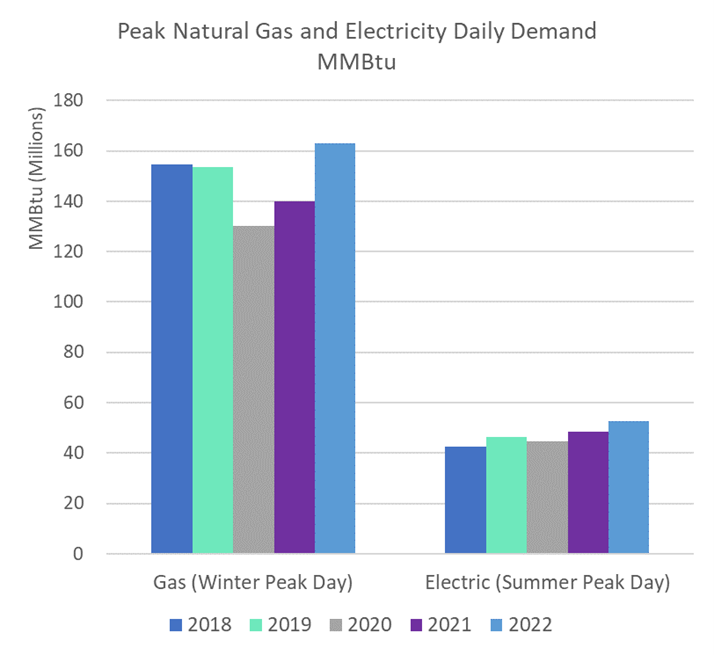
- During the 2020 and 2021 winter heating seasons, peak day demand was lower than in recent years due to both demand impacts from the ongoing global pandemic as well as back-to-back winters with warmer-than-average national temperatures.
- During the hottest day in the summer when cooling demand will be at its highest, the electric grid set a record of 15,465 GWh compared to last year’s record of 14,168 GWh.
- Converting the two sources of energy to total daily MMBtu, the record demand day for gas was 163.0 million MMBtu compared to 52.8 million MMBtu for electricity. This demonstrates that the gas distribution system on the coldest days can supply 3.1 times as much energy per 24 hours as the electric grid on the hottest days.
Supplemental Materials
| Year | Date | Gas Peak Day MMBtu | Date | Electric Peak Day MMBtu |
| 2022 | 12/24/2022 | 162,949,332 | 7/20/2022 | 52,770,472 |
| 2021 | 2/14/2021 | 139,913,872 | 8/12/2021 | 48,345,927 |
| 2020 | 2/14/2020 | 130,118,492 | 7/19/2020 | 44,646,974 |
| 2019 | 1/30/2019 | 153,403,628 | 7/19/2019 | 46,478,711 |
| 2018 | 1/1/2018 | 154,690,340 | 7/5/2018 | 42,433,343 |
AGA Contact: Brendan O’Brien (bobrien@aga.org) 202-824-7220.
NOTICE
In issuing and making this publication available, AGA is not undertaking to render professional or other services for or on behalf of any person or entity. Nor is AGA undertaking to perform any duty owed by any person or entity to someone else. Anyone using this document should rely on his or her own independent judgment or, as appropriate, seek the advice of a competent professional in determining the exercise of reasonable care in any given circumstances. The statements in this publication are for general information and represent an unaudited compilation of statistical information that could contain coding or processing errors. AGA makes no warranties, express or implied, nor representations about the accuracy of the information in the publication or its appropriateness for any given purpose or situation. This publication shall not be construed as including, advice, guidance, or recommendations to take, or not to take, any actions or decisions any matter, including without limitation relating to investments or the purchase or sale of any securities, shares or other assets of any kind. Should you take any such action or decision; you do so at your own risk. Information on the topics covered by this publication may be available from other sources, which the user may wish to consult for additional views or information not covered by this publication.
Copyright © 2023 American Gas Association. All rights reserved.