Energy Insights: Peak Domestic Demand for Natural Gas and Electricity
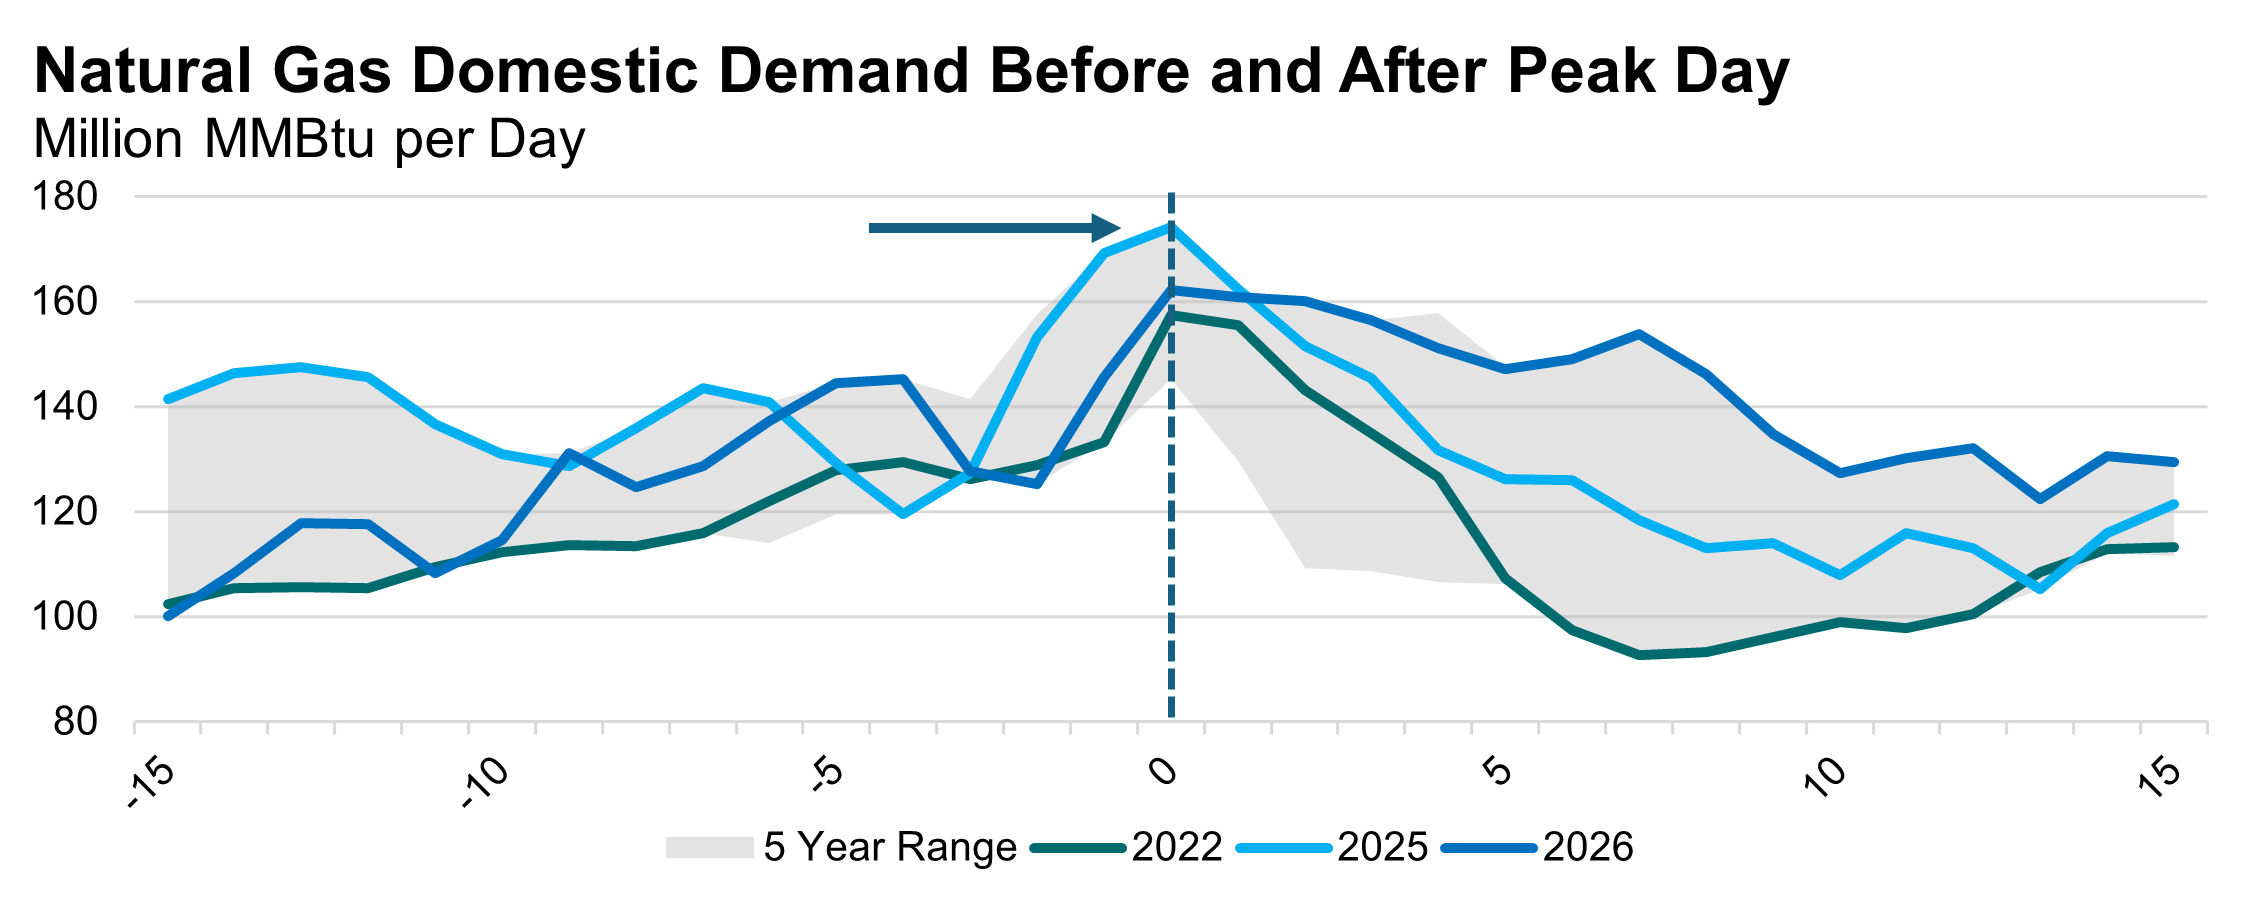
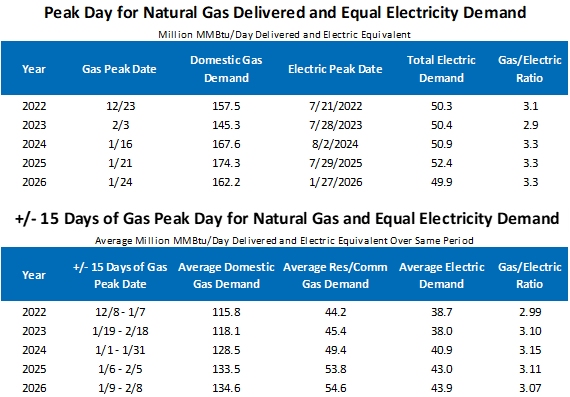
On the coldest winter days, the U.S. natural gas system delivers more energy than the electric grid does on even the hottest summer day. AGA estimates that peak-day gas deliveries at the record were 3.3 times larger than peak electric deliveries, while this winter’s peak was also 3.3 times larger. That scale was on display during Winter Storm Fern in January 2026, when total natural gas demand reached 156.4 Bcf/day or 162.2 million MMBtu/day in a single day. The largest record for natural gas deliveries was set last winter with a total volume delivered of 174.3 million MMBtu/day. And while this winter did not surpass last winter’s all-time peak, the winter of 2026 had the highest average of 135 million MMBtu/day in the 15 days before and after the event.
Key Findings
- The U.S. natural gas system reached a peak domestic demand of 162.2 million MMBtu/day on January 16, 2026. The record remains 174.3 million MMBtu/day, set on January 24, 2024.
- This domestic demand measure includes natural gas delivered to power generation, residential, commercial, and industrial customers. It does not include additional demand for liquefied natural gas export feedgas or pipeline exports to Mexico.
- Although this winter did not set a new single-day record, it did exceed the total amount of gas delivered in the 15 days leading up to and after the annual peak day. Relative to the recent peak in 2022, daily demand this winter exceeded 2022 levels on most days during the comparable +/- 15-day period.
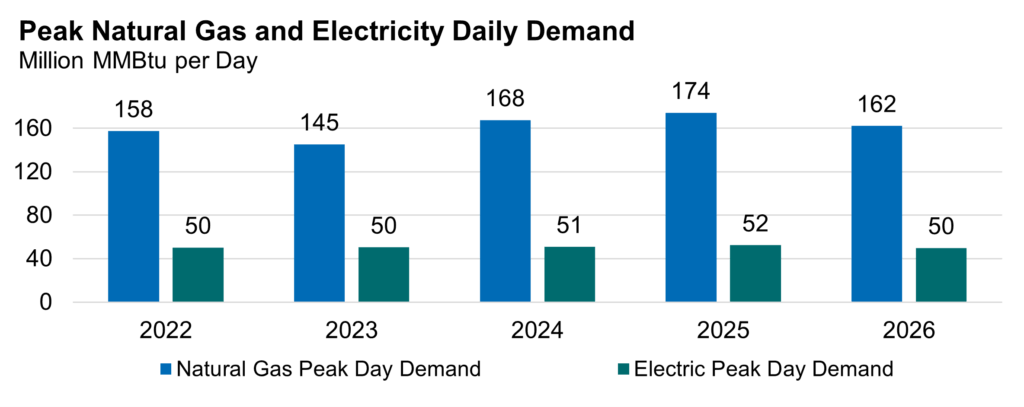
- The electric system also recorded a summer peak demand day in 2025. Comparing that summer electric peak with the natural gas peak set in 2024 shows that, on their respective high-demand days, the natural gas system delivered about 3.3 times as much energy.
- Peak winter demand underscores the value and affordability of natural gas: it delivered more than three times the energy to households at less than one-third the cost of electricity[1]. Deliveries to natural gas residential and commercial end uses over the 15 days leading up to and after the peak exceed the entire electric system by 25%.
[1] EIA Projects Rising Electricity Prices, Widening the Gap with Natural Gas to 4.0x in 2027 – American Gas Association
Source: Chart and Tables Developed by AGA using S&P Global for Natural Gas Demand and EIA Grid Monitor for Electric Demand
AGA Contact: Brendan O’Brien | bobrien@aga.org | 202-824-7220
Notice: In issuing and making this publication available, AGA is not undertaking to render professional or other services for or on behalf of any person or entity. Nor is AGA undertaking to perform any duty owed by any person or entity to someone else. Anyone using this document should rely on his or her own independent judgment or, as appropriate, seek the advice of a competent professional in determining the exercise of reasonable care in any given circumstances. The statements in this publication are for general information and represent an unaudited compilation of statistical information that could contain coding or processing errors. AGA makes no warranties, express or implied, nor representations about the accuracy of the information in the publication or its appropriateness for any given purpose or situation. This publication shall not be construed as including advice, guidance, or recommendations to take, or not to take, regarding any matter, including without limitation relating to investments or the purchase or sale of any securities, shares or other assets of any kind. Should you take any such action or decision; you do so at your own risk. Information on the topics covered by this publication may be available from other sources, which the user may wish to consult for additional views or information not covered by this publication.
Copyright © 2026 American Gas Association. All rights reserved