Four Decades of Progress: How Efficiency Has Cut Gas Bills and Emissions in Half
Over the past four decades, the U.S. average household using natural gas has steadily reduced its annual consumption by 1.1% per year, even as the total number of consumers grew by 1% annually. Improvements in building efficiency, appliance performance, and new heating systems have driven this trend, cutting consumer costs and emissions. Understanding how energy use has changed over time also provides valuable insight into future affordability and the potential for further emission reductions through the use of renewable natural gas (RNG) and advanced technologies.
Key Insights
- Per-Household Gas Use Down 38% Since 1982
After adjusting for weather, average household consumption has declined 1.1% per year, a consequence of tighter buildings, more efficient appliances, and consumer energy conservation.
- Real Natural Gas Bills Have Fallen by 43%
Inflation-adjusted residential gas bills have dropped by nearly half since 1982, reflecting both lower per-household use and sustained affordability of natural gas prices.
- Household Emissions are Down More than 40%
Per-home greenhouse gas emissions declined thanks to greater energy efficiency and modernization of gas infrastructure. Continued efficiency and the use of RNG could reduce emissions by a further 65% by 2050.
- Renewable Natural Gas Can Reduce Emissions Affordably
Even with RNG blended into natural gas supply, projected 2050 household bills remain comparable to today’s while achieving a steep reduction in emissions.
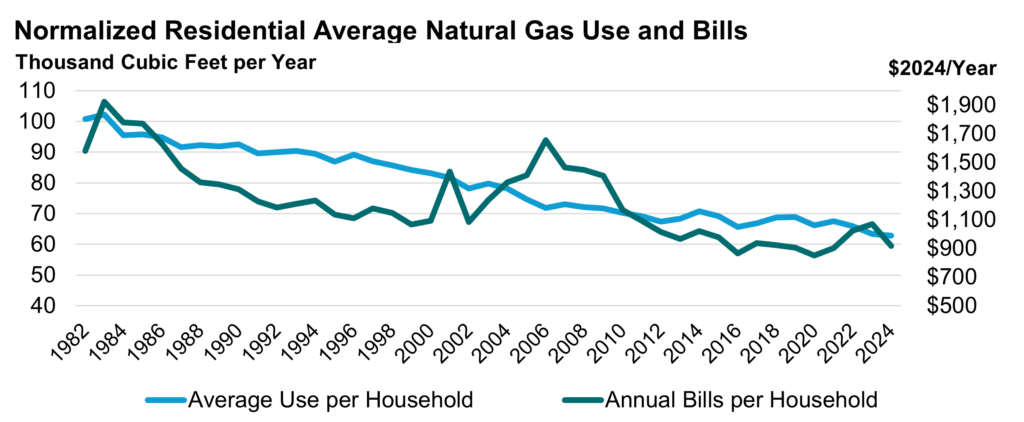
Historical Trends in Natural Gas Consumption and Bills Show a Downward Trend
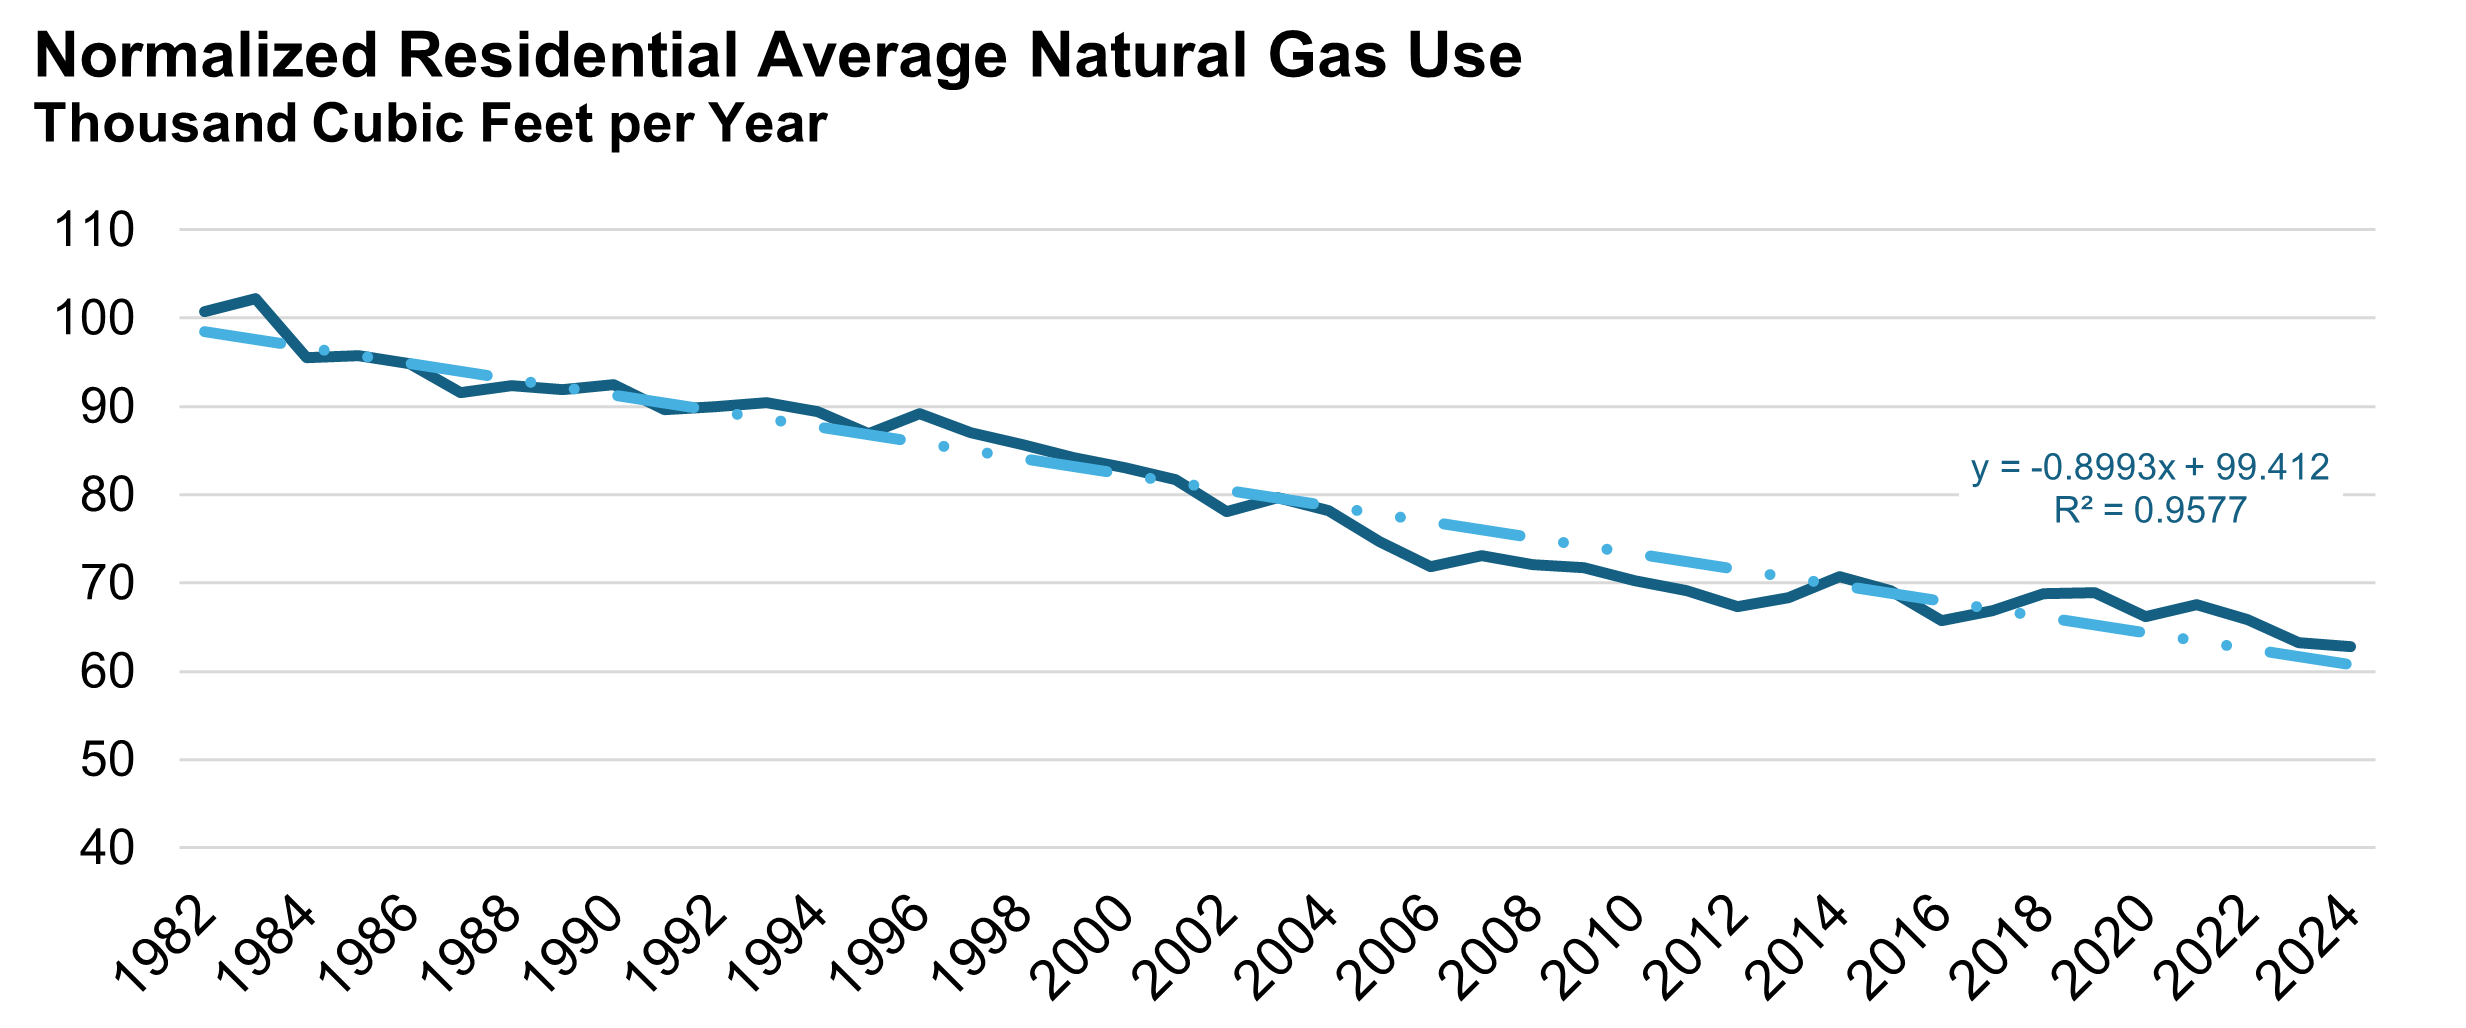
Consumption was normalized using NOAA heating degree day (HDD) data to isolate structural efficiency improvements independent of weather. Normalization used the ratio of actual HDDs to the 30-year normal. Average use is calculated by dividing total normalized consumption by the number of residential households that utilized natural gas that year. Average normalized gas use has declined steadily, dropping by about 38% since the early 1980s, or roughly 1.1% per year, showing the cumulative impact of improved insulation, tighter construction, and the widespread adoption of high-efficiency furnaces and other appliances, utility efficiency programs, and consumer conservation.
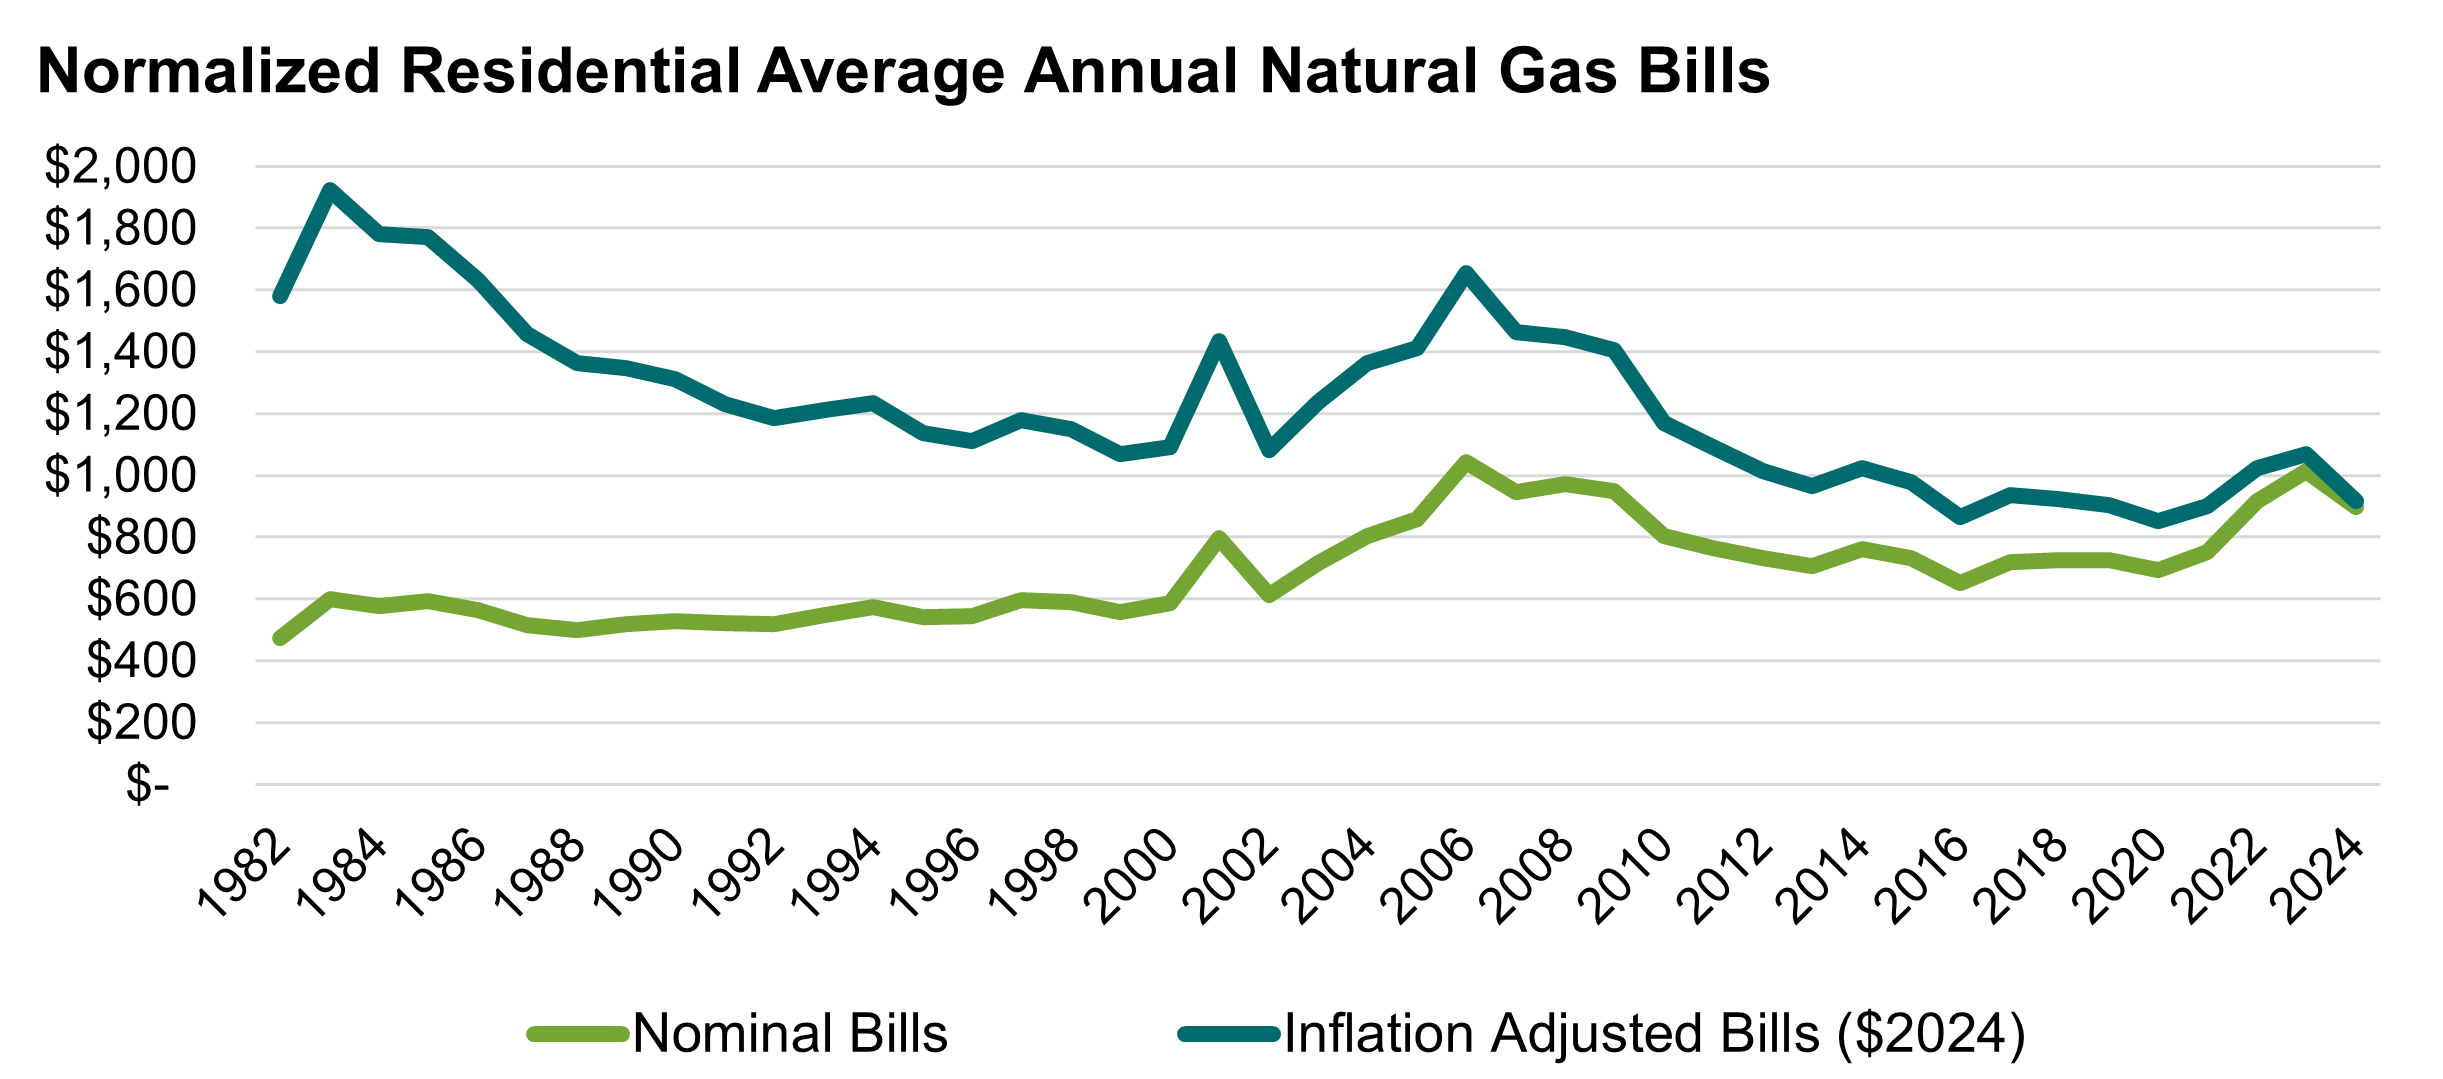
Bills were analyzed in nominal dollars and inflation-adjusted (real) terms using monthly CPI data from the Bureau of Labor Statistics. Real bills provide a clearer picture of how affordability has changed over time. While nominal bill amounts have risen between 1982 and 2024 due to inflation, real (inflation-adjusted) bills declined by more than 40%, underscoring that reduced consumption has driven long-term affordability gains rather than price fluctuations.
Emissions have declined across the natural gas value chain
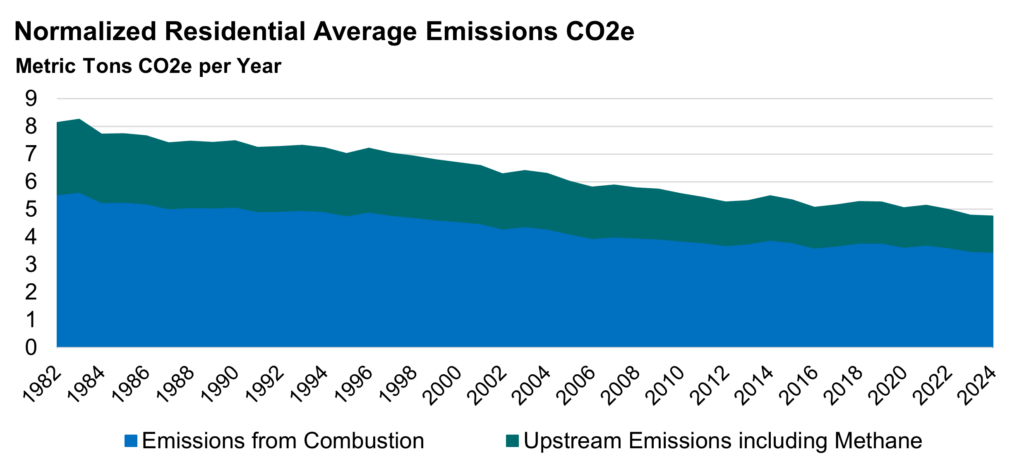
Greenhouse gas emissions per household have fallen by more than 40% over the 42-year study period. Household emission reductions reflect some, but not all, improvements made to the natural gas infrastructure, as well as reduced gas consumption per household from energy efficiency measures.
Using an EPA lifecycle emissions factor of 73 kg/MMBtu, which accounts for combustion emissions at the point of use and upstream emissions, this analysis adjusts the EPA factor for historical years using the EPA greenhouse gas inventory to account for changes in annual methane emissions.
Natural gas emissions have declined over time, primarily due to operational improvements and infrastructure modernization investments across the gas value chain. For example, gas utility replacement programs targeting older materials, such as cast iron and bare steel, in conjunction with improved operational practices, including leak detection and repair, have resulted in a 70% reduction in greenhouse gas emissions from natural gas distribution systems.
Bills and Emissions through 2050 Show Natural Gas Stays Competitive
If residential gas use continues to decline by 1.1% per year, household consumption would be roughly 22% lower by 2050 than in 2024. Continued improvements in energy efficiency may be achieved through building improvements, adoption of higher-efficiency equipment (e.g., condensing furnaces and water heaters), and the use of emerging solutions such as gas-fired heat pumps and hybrid air-source heat pumps paired with gas furnaces. Potential energy reductions can reach up to 50% per household beyond what current high-efficiency furnaces may achieve.
The EIA’s 2025 Annual Energy Outlook projects that residential gas prices will be relatively flat through 2050: $13-15 per thousand cubic feet (Mcf) in 2024 dollars.[1] EIA projects an average decline of 27% to 44.4 Mcf per household by 2050 (5% more than this analysis’s model).
Under these assumptions, the projected average annual residential bill ($2024) is:
- $916 in 2024
- $738 in 2035
- $660 in 2050
RNG further reduces emissions with modest bill impacts
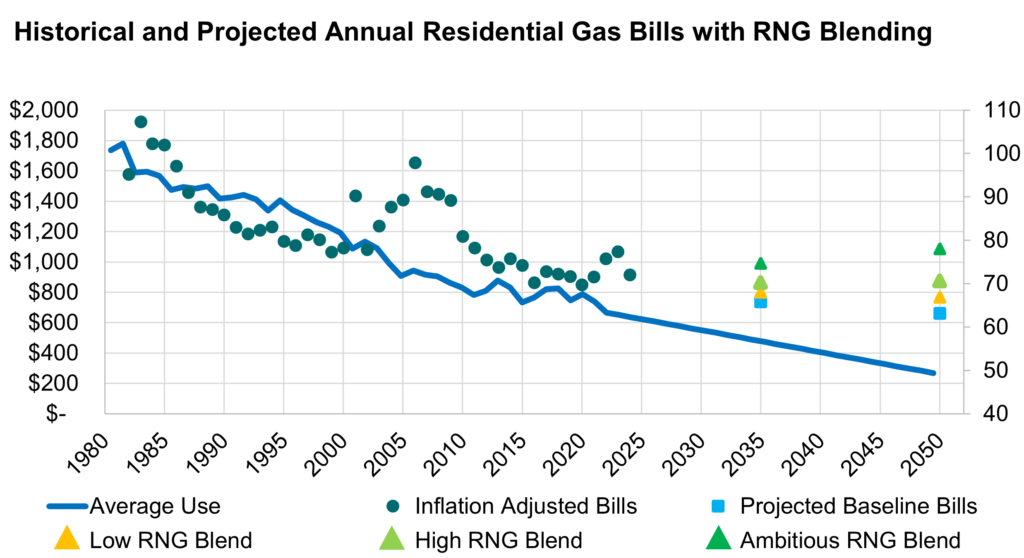
Low-carbon natural gas resources and continued efficiency improvements provide pathways to decarbonize homes and businesses while keeping average bills within recent historical ranges.
A 2025 study from the American Gas Foundation (AGF) estimates more than 16,000 trillion BTU (TBtu) per year in technical renewable natural gas resources and models three RNG production scenarios that deliver the equivalent of 10%, 20%, or 40% of gas utility demand by 2050. Across all three RNG scenarios, over 90% of RNG could be produced at approximately $25 per Mcf, implying a delivered residential price of nearly $35 per Mcf (in 2024 dollars).[2] Over time, innovations such as lower-cost synthetic methane production, enhanced RNG capture with hydrogen, and economies of scale are likely to reduce costs further.
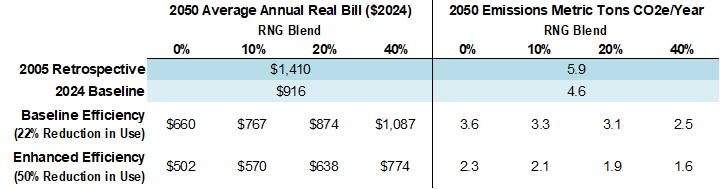
Even modest blending produces outsized emissions benefits. Continuing with today’s efficiency trends without RNG, reduces emissions by 22%. Adding RNG yields a reduction of 44% with 10% blending, 48% under 20% blending, and 57% at 40% blending.
Emerging technologies offer even greater savings. Natural-gas-powered heat pumps and hybrid systems that pair a heat pump with a gas furnace could double efficiency improvements, leading to a 50% reduction in average energy use relative to current levels (28 percentage points more than the projected 22% baseline trend).
Under the enhanced-efficiency case modeled, the projected average annual bills are $502 with no RNG; $570 with a 10% RNG blend; $638 with 20%; and $774 with 40% (all in 2024 dollars). Emissions reductions reach 50% with no RNG and approximately 54% (10% blend), 58% (20% blend), and 65% (40% blend) relative to 2005 levels.
Overall, combining additional efforts on energy efficiency with RNG could reduce emissions from 4.6 metric tons in 2024 to 1.6 metric tons per year by 2050, while lowering the average annual cost by a projected $142 compared to today.[3]
Possible Outcomes for Natural Gas Bills and Household Emissions by 2050
This enhanced-efficiency outlook does not include the upfront investments required to deploy these measures. By contrast, the baseline already reflects market-driven appliance choices today. As more households upgrade to condensing equipment, subsequent replacements between now and 2050 could shift toward options that carry higher initial costs but deliver greater savings. These investments become even more valuable when combined with RNG blending, further improving cost outcomes and emissions reductions.
Conclusion and Outlook to 2050
The long-term data show that smarter efficiency and system modernization have made natural gas cleaner and cheaper for U.S. households. Over more than four decades, weather‑normalized residential gas use has declined about 1.1% per year, totaling 38% since the early 1980s. Long-term efficiency gains have contributed to a 43% drop in inflation‑adjusted average household gas bills since 1982.
Looking ahead, if efficiency gains continue and prices track EIA’s reference outlook, average inflation-adjusted bills are projected to decline over time from $916 in 2024 to $660 by 2050 ($2024). At the same time, blending low-carbon fuels such as renewable natural gas (RNG) can significantly reduce emissions while maintaining affordability. Across all three referenced RNG supply scenarios, average household bills stay below the recent near‑term high of ~$1,100 (and often at or below today’s $916), while per‑home emissions fall roughly 44 to 57% versus current levels; pairing RNG with deeper efficiency can deliver ~65% reductions relative to today while maintaining affordability.
Footnotes
[1] Tables 3 for prices and 4, and 21 for average use comparison
[2] RNG mix could be different in actual depending on blend of each different source of RNG developed by 2050.
[3] Bill impacts were calculated by separating fixed and variable portions of the bi. In 2024, the national average fixed charge was $18.85/month ($226 per year in $2024), essentially unchanged in real terms from 2014. This analysis assumes the fixed charge remains constant through 2050 and then adjusts the bill by removing the fixed portion to infer a variable price per Mcf. It then applies an additional 28% annual usage decline (50% – 22% baseline) to that variable price and adds the fixed charge back.
AGA Contact: Brendan O’Brien, 202-824-7220.
A special thanks to Ferdinand Rother for his contributions to this analysis.
Notice
In issuing and making this publication available, AGA is not undertaking to render professional or other services for or on behalf of any person or entity. Nor is AGA undertaking to perform any duty owed by any person or entity to someone else. Anyone using this document should rely on his or her own independent judgment or, as appropriate, seek the advice of a competent professional in determining the exercise of reasonable care in any given circumstances. The statements in this publication are for general information and represent an unaudited compilation of statistical information that could contain coding or processing errors. AGA makes no warranties, express or implied, nor representations about the accuracy of the information in the publication or its appropriateness for any given purpose or situation. This publication shall not be construed as including advice, guidance, or recommendations to take, or not to take, regarding any matter, including without limitation relating to investments or the purchase or sale of any securities, shares or other assets of any kind. Should you take any such action or decision; you do so at your own risk. Information on the topics covered by this publication may be available from other sources, which the user may wish to consult for additional views or information not covered by this publication.
Copyright © 2025 American Gas Association. All rights reserved.