Growth in Natural Gas Mains by Material
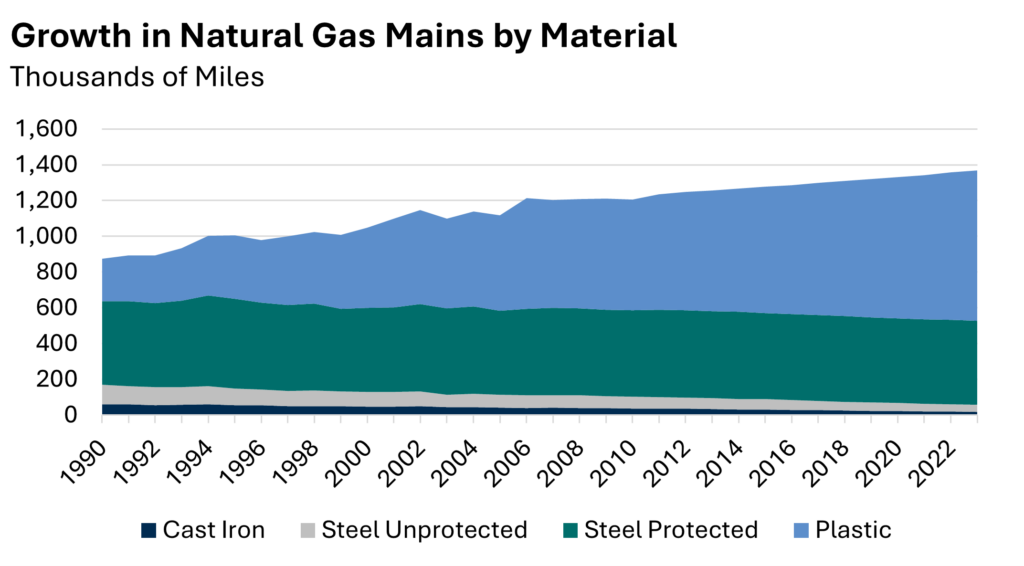
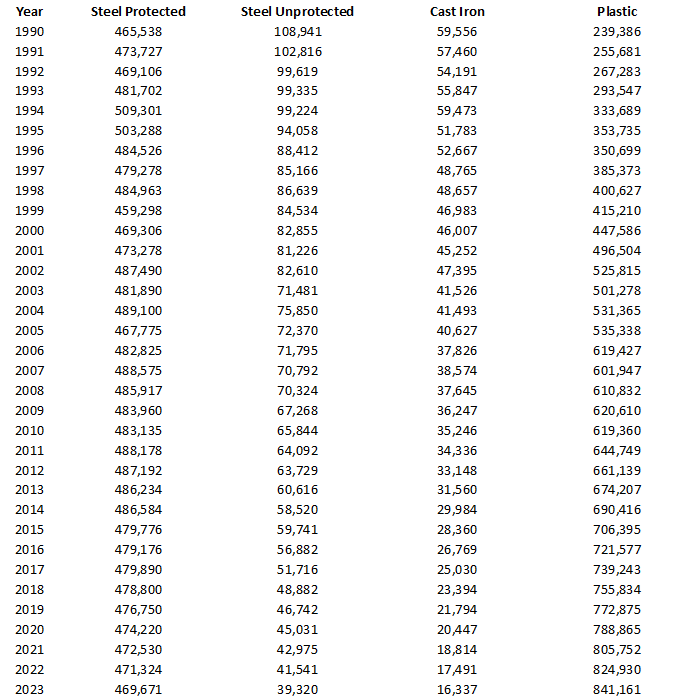
- The total mileage of natural gas mains in the U.S. has steadily increased since 1990. At that time, there were 874,000 miles of mains. By 2023, this figure had grown to over 1.37 million miles, representing a 56% increase. This expansion averaged about 15,000 miles of new mains added annually, totaling 494,000 miles since 1990.
- Natural gas main pipelines supply energy to 72 million homes and businesses. Each meter is linked to a smaller service line, which connects to the larger main pipe managed by local natural gas distribution companies. Since 1990, the total length of service lines has increased from 595,000 miles to 982,000 miles, marking a 65% growth over 33 years.
- The growth in service lines equates to an average of 11,725 miles added each year. Over the same period, 23.4 million new homes and businesses have been connected to the system, averaging 710,000 new natural gas customers annually with an average length of 87 feet.
- In 1990, plastic pipes made up only 27% of all gas main pipelines. Since then, efforts to replace older leak-prone pipes and install new ones have significantly expanded their presence. Today, plastic pipes account for over 250% more miles than in 1990, representing 62% of the total 1.37 million miles of mains in operation.
- Replacement programs have primarily targeted cast iron and unprotected steel pipes. In 1990, these materials comprised 7% and 13% of the system, respectively. Now, they collectively account for just 4% of the total system. The total mileage of these pipes has dropped from 168,500 miles to under 28,000 miles, an 83% reduction since 1990.
Notice
In issuing and making this publication available, AGA is not undertaking to render professional or other services for or on behalf of any person or entity. Nor is AGA undertaking to perform any duty owed by any person or entity to someone else. Anyone using this document should rely on his or her own independent judgment or, as appropriate, seek the advice of a competent professional in determining the exercise of reasonable care in any given circumstances. The statements in this publication are for general information and represent an unaudited compilation of statistical information that could contain coding or processing errors. AGA makes no warranties, express or implied, nor representations about the accuracy of the information in the publication or its appropriateness for any given purpose or situation. This publication shall not be construed as including advice, guidance, or recommendations to take, or not to take, regarding any matter, including without limitation relating to investments or the purchase or sale of any securities, shares or other assets of any kind. Should you take any such action or decision; you do so at your own risk. Information on the topics covered by this publication may be available from other sources, which the user may wish to consult for additional views or information not covered by this publication.
Copyright © 2025 American Gas Association. All rights reserved.