Natural Gas Market Indicators – 500th Edition
Natural Gas Market Summary: Then and Now
It is no exaggeration to say that the U.S. energy sector has undergone a profound transformation driven by the technological breakthroughs of the Shale Revolution. It was little more than two decades ago that major national publications warned that the U.S. was “running out of energy” and that natural gas was in dangerously scarce supply. Today, the U.S. is the world’s leading producer of natural gas, the largest consumer, and the largest exporter. This is a far cry from where things seemed to be headed twenty years ago.
In the mid-2000s, the American Gas Association launched the Natural Gas Market Indicators (NGMI) series. It began as an internal briefing for AGA executives, providing context on market trends that influenced underground storage, as the U.S. underground storage report was then administered by AGA. There was a hunger for more information about the natural gas market, and the NGMI evolved it into a regular publication.
Since 2005, NGMI has told the story of a rapidly evolving U.S. natural gas market. Production surged and ultimately doubled as technological breakthroughs unlocked new supplies, which soon drove a wave of demand growth, lower consumer energy costs, and reductions in emissions. The U.S. emerged as the number one LNG exporter while gas infrastructure grew and adapted to meet new consumer needs. More recently, growing electricity needs and a resurgent manufacturing base are boosting demand while homes and businesses continue to connect to the natural gas system.
For the 500th edition of NGMI, we look back twenty years to see not only where we were, but where many in the energy space at the time thought we were going. We are pleased to present a data-driven retrospective of the U.S. energy evolution, illustrated through charts and analysis. The Market Indicators team thanks you for being part of this ongoing journey.
Natural Gas Price Projections vs. Reality: An Era of Unexpected Affordability
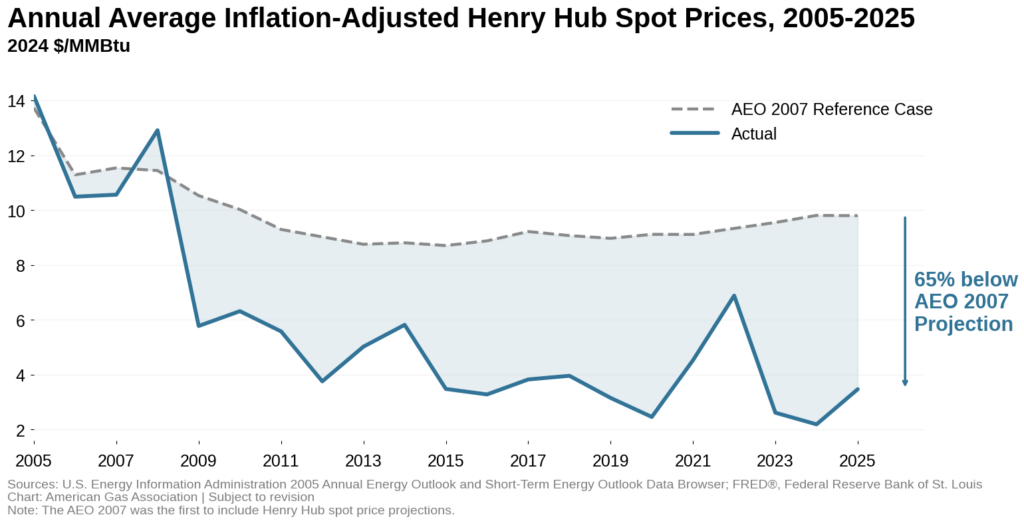
In the mid-2000s, prevailing forecasts reflected a future in which natural gas prices would remain elevated for years, constrained by declining domestic supplies and an increased reliance on imports. In its 2007 Annual Energy Outlook (AEO), the Energy Information Administration (EIA) reported that Henry Hub spot prices averaged about $13.70 per MMBtu (in 2024 inflation-adjusted dollars) in 2005 and projected that prices would drop only modestly in future years before stabilizing at an average price of approximately $9.30 per MMBtu (in 2024 inflation-adjusted dollars) between 2016 and 2025.
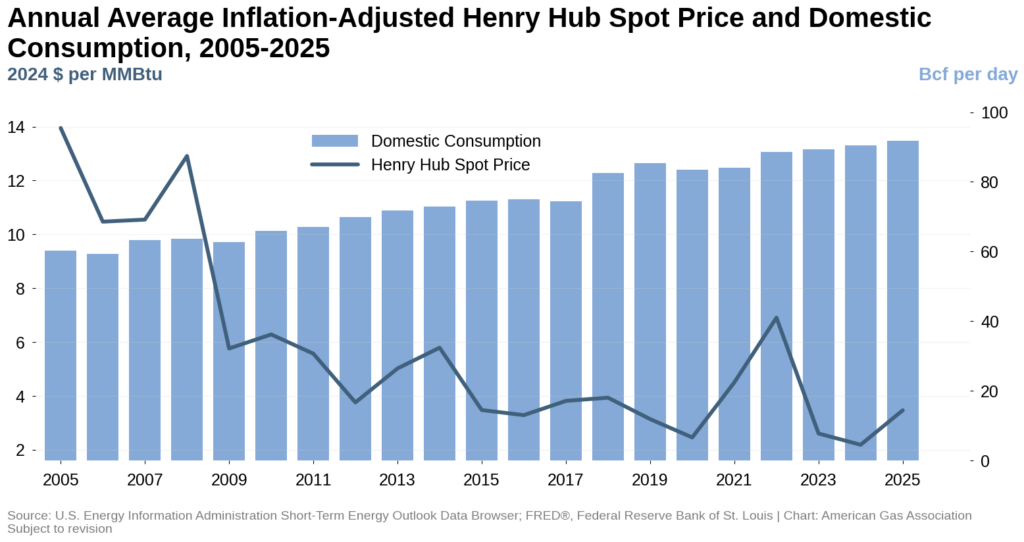
Of course, natural gas prices took a markedly different path. Between 2016 and 2025, Henry Hub spot prices averaged around $3.60 per MMBtu (in 2024 inflation-adjusted dollars), falling to a historic low of $2.19 per MMBtu in 2024, even as domestic natural gas demand reached an annual record of 90.4 Bcf per day. Expanded production—spurred by high prices, enabled by technological advances in horizontal drilling and hydraulic fracturing, and supported by a robust infrastructure base—led to a downward trend in natural gas prices that continues to be felt today.
From Supply Constraints to Resource Abundance: A Rising Production Trajectory
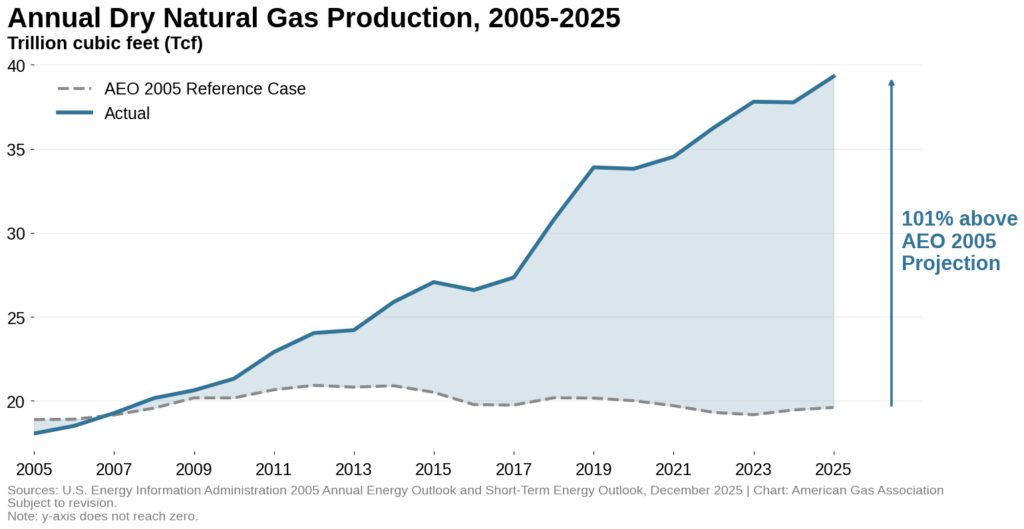
The EIA said in its May 2005 Short-Term Energy Outlook (STEO) that “[d]omestic natural gas production in 2005 is expected to remain near the 2004 level, despite an expected 13-percent increase in gas directed drilling,” but that prices would “…remain in the range of $6.50 to $7.00 per mcf…” into mid-2005. At that time, the EIA cited “…limited prospects for growth in domestic natural gas…” as a primary source of support for its price projections. The long-term production outlook reflected this view. The 2005 AEO projected that U.S. dry natural gas production would grow slowly over the next two decades, by less than 4 percent from 2005 to 2025, with most of the incremental growth expected to come from unconventional sources and Alaska. The EIA also expected annual output to peak near 21 Tcf in 2012 before settling into a relatively stable range of around 19 to 20 Tcf per year.
The last two decades unfolded very differently. U.S. natural gas production surpassed the 2005 forecast peak two years earlier than expected and continued to rise, sometimes at unprecedented rates, instead of flattening. According to the December 2025 STEO, the EIA now expects U.S. dry gas production to exceed 39 Tcf in 2025, over 100 percent higher than the projection it made in 2005.
The 2005 outlook also anticipated a decline in associated gas production. At the time, the EIA projected that volumes would fall from 3.1 Tcf in 2010 to 2.4 Tcf by 2025, accounting for only a small share—roughly 12 percent—of total U.S. dry gas supply. Instead, associated gas production rose sharply, averaging 6.8 Tcf in 2024, nearly three times higher than the 2005 AEO projection for 2025.
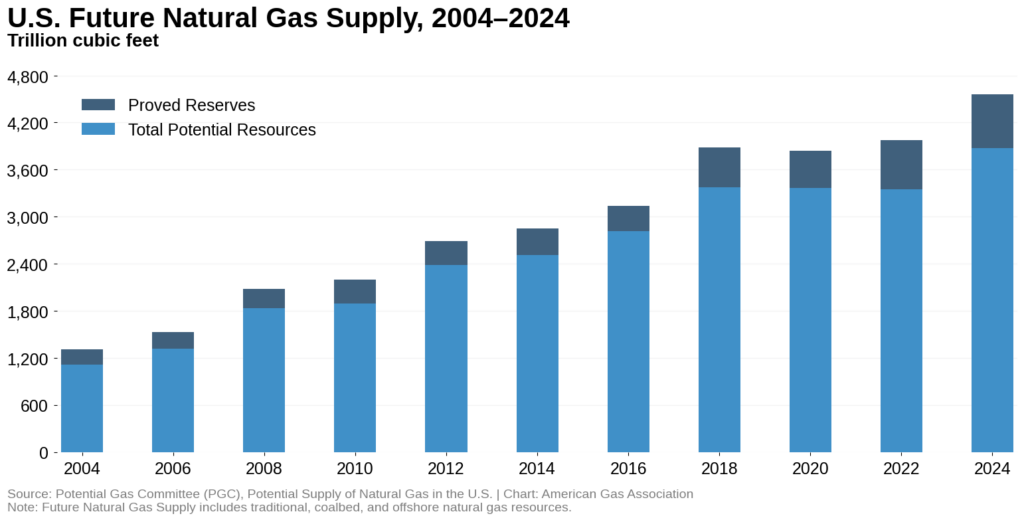
In the mid-2000s, U.S. natural gas supply assessments reflected concerns about long-term resource adequacy. In 2004, the Potential Gas Committee (PGC) estimated that there were just over 1,100 Tcf of total potential U.S. natural gas resources, including technically recoverable resources and proved reserves. Those estimates increased sharply as exploration and production technology improved. Production enabled more demand, which in turn spurred more exploration and production. Producers would offset existing depletion by “proving up higher reserves through new field discoveries, field extensions, and new pool discoveries,” according to the PGC’s 2024 assessment.
By 2012, the total future supply had more than doubled from 2004, and by 2024, it had tripled. In its 60th anniversary report, the PGC estimated that total technically recoverable U.S. natural gas resources in 2024 had increased to nearly 3,900 Tcf. When combined with growing proved reserves, total future supply levels have never been higher. The Atlantic area remains the largest U.S. share, with 39 percent of traditional resources. Together, these trends reflect a marked shift from the supply-constrained outlooks common in the early 2000s to a recognition of a large and durable U.S. natural gas resource base.
Rigs: How Efficiency Gains Reshaped the Production Paradigm
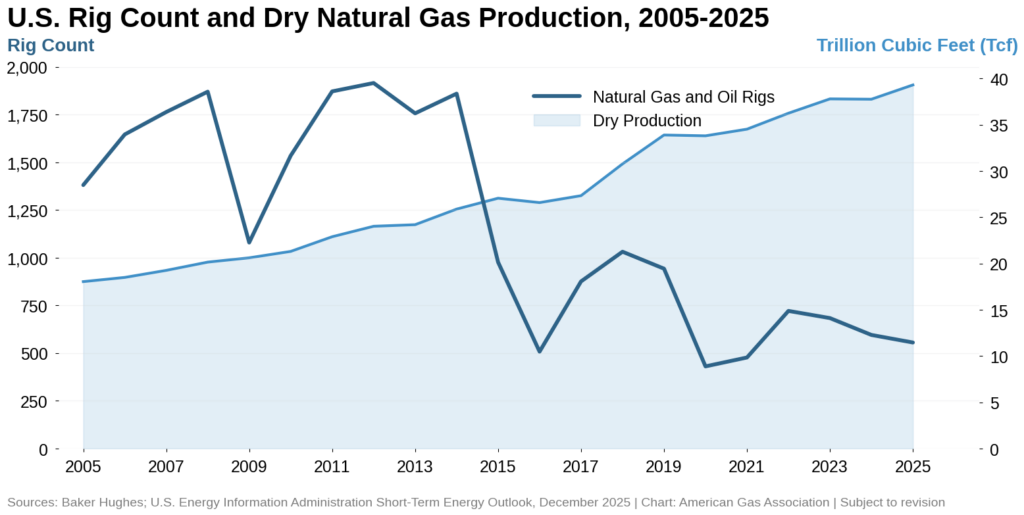
Over the past two decades, efficiency gains have transformed U.S. natural gas production. Advances in drilling technology and well productivity now enable far fewer rigs to produce far greater volumes of natural gas.
As a result, total rig counts have fallen sharply even as production has reached record highs. The annual average number of natural gas and oil rigs declined from 1,380 in 2005 to 556 in 2025. For natural gas rigs specifically, the annual average number fell from 1,186 in 2005 to just 112 in 2025. This shift is also reflected in the broader rig mix as natural gas rigs fell from nearly 86 percent of U.S. rigs in 2005 to 20.4 percent in 2025.
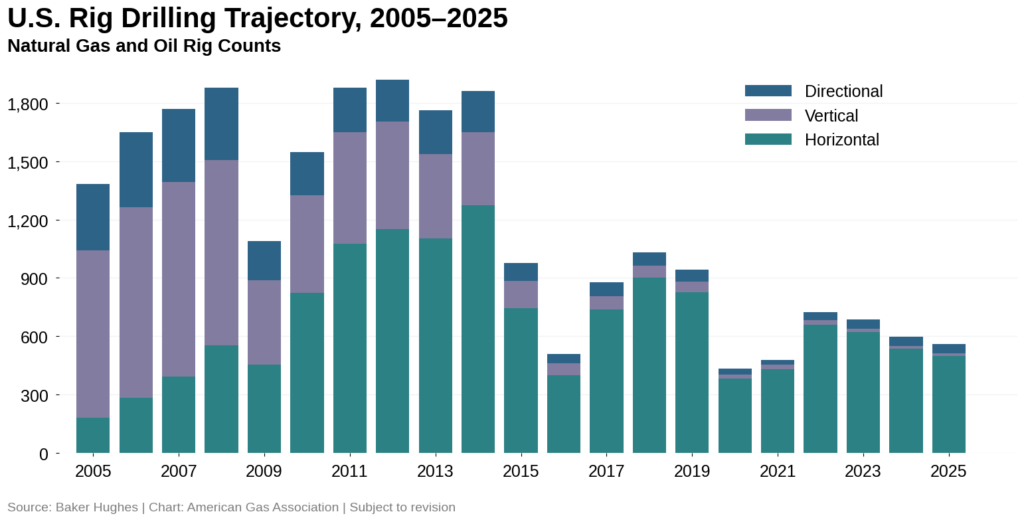
Rig activity has also shifted dramatically toward horizontal drilling, reflecting the rise of shale and other tight formations, as well as the technologies used to extract resources. In 2005, vertical rigs accounted for more than 62 percent of all oil and gas rigs, while horizontal rigs represented just 13 percent. By 2025, that balance had flipped, with vertical rigs comprising just 2.3 percent of the total, while horizontal rigs accounted for nearly 89 percent, underscoring how horizontal drilling and associated completion technologies allowed operators to access larger resource volumes with fewer surface wells.
Natural Gas Demand Accelerates Across the U.S. Economy
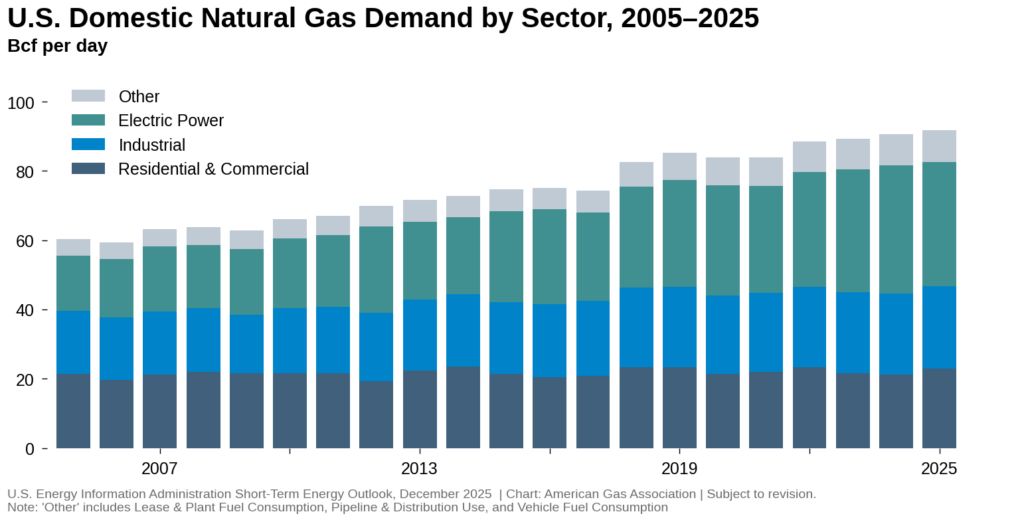
The 2005 AEO reference case projected U.S. domestic consumption in 2025, including electric power, residential and commercial, industrial, lease and plant fuel, pipeline and distribution use, and vehicle fuel consumption, would reach 83 Bcf per day. In contrast, the EIA’s December 2025 STEO reports 2025 demand to be nearly 92 Bcf per day, about 10 percent higher than what was projected at the time in 2005.
As consequential of a story is how this growth has unfolded by sector. The 2005 AEO assumed a relatively balanced mix of demand growth across sectors, with roughly 52 percent driven by the electric power sector and about 21 percent stemming from higher residential and commercial loads. In reality, electric power consumption has accounted for 62.8 percent of all demand growth since 2005, while industrial demand grew by 17.7 percent. “Other” uses—including lease and plant fuel consumption, pipeline and distribution use, and vehicle fuel consumption—increased by 14.7 percent, and residential and commercial demand rose by about 4.9 percent.
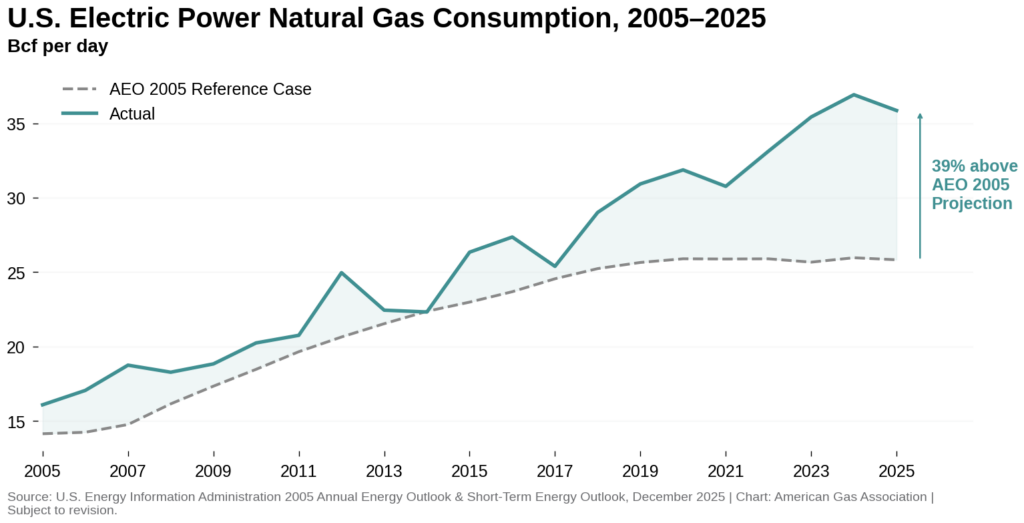
Historically, fuel use for electric power generation has been largely contingent on two key factors: availability and price. What fuels are available, and what are their relative costs? Conventional wisdom in 2005 was that natural gas would remain relatively expensive compared to coal and that domestic production would remain muted. Moreover, total electricity consumption was expected to continue rising across the residential, commercial, and industrial sectors for the next two decades (in reality, total electricity demand has been flat for nearly 15 years and has only begun to rise again in recent years). Therefore, the 2005 AEO projected that coal would remain the top source of electricity generation in 2025, reporting that “much of [coal’s growth in the electric power sector] is expected after 2010, when higher natural gas prices make coal a more competitive fuel for power plants.”
As natural gas prices began to fall sharply in the late 2000s, coal’s share of the electric generation mix began to decline as well. Policy changes further compounded the economics that favored new natural gas plants and more dispatch away from coal to natural gas in the existing electric grid mix. In 2005, coal generation accounted for about half of total electricity generation. Natural gas officially surpassed coal as the main fuel source for electricity generation in 2016, and the share of electricity generated from natural gas doubled to over 40 percent from 2005 to 2025. Coal’s share of electricity generation fell to 17 percent, according to Rystad Energy.
As of the December 2025 STEO, power sector consumption is expected to reach 35.9 Bcf per day in 2025, which is 2.2 times greater than 2005 levels and roughly 10 Bcf per day higher than the 2005 AEO projection.
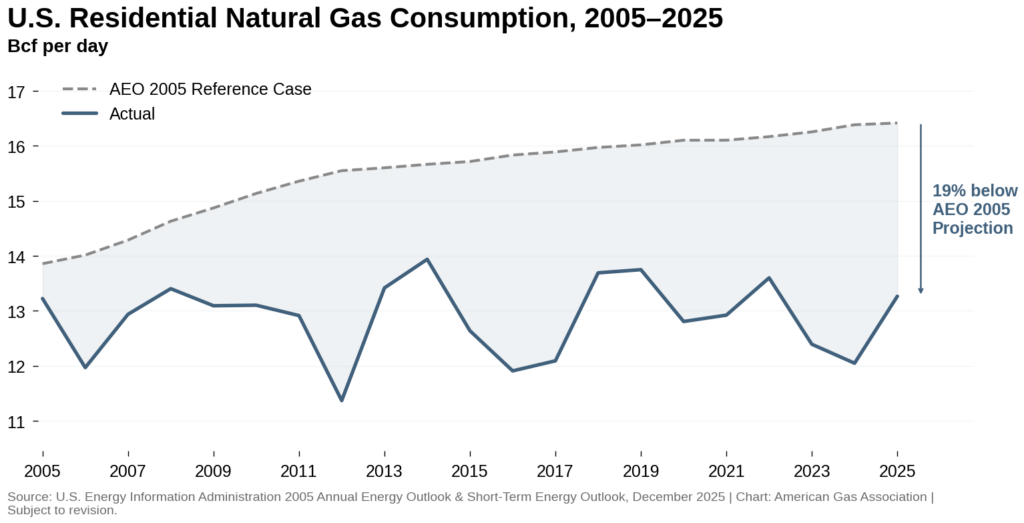
Importantly, residential sector natural gas demand lagged 2005 projections rather than exceeding them. The 2005 AEO projected residential demand to increase from approximately 14 Bcf per day to more than 16 Bcf per day by 2025, representing a modest rise. Instead, actual residential demand has effectively plateaued over the last two decades, with year-to-year variance in demand largely reflecting shifting heating demand in response to winter weather severity.
In 2005, most projections for residential demand growth assumed that more customers would result in a relatively proportionate increase in demand. However, customer additions grew by an estimated 15 percent between 2005 and 2025 despite flat consumption, with residential customer growth accounting for 96 percent of net growth.
Why the discrepancy? The 19 percent difference between 2005 projections and actual 2025 residential consumption is the result of stronger-than-expected energy efficiency gains—via codes, utility efficiency programs, rising appliance efficiency, and related improvements—and a major departure from 2005 housing growth assumptions. The 2005 forecast used pre-2008 expectations for new home construction and household growth that did not materialize at the projected pace following the 2008 recession. Moreover, the 2005 AEO did not (and could not) account for policy-driven conservation measures beyond those already legislated, or any of the behavioral changes that ultimately led to greater energy conservation.
This lowered demand has material impacts on emissions as well. The cumulative difference in natural gas consumption between the 2005 AEO reference case projection and 2025 actual demand is 20.2 Tcf. In volumes of CO2, this is the same as reducing emissions by an estimated 1.1 billion metric tons of CO2. The reduction is analogous to the emissions of 264 million gasoline-powered passenger vehicles driven on the road for one year or 13 million vehicles driven on the road for two decades. For perspective, California has approximately 13.4 million registered passenger automobiles, so all else being equal, the reduction in emissions is roughly the same as taking the California’s entire passenger car fleet off the road for two decades.
U.S. Trade: Import-Constrained to Export-Dominant
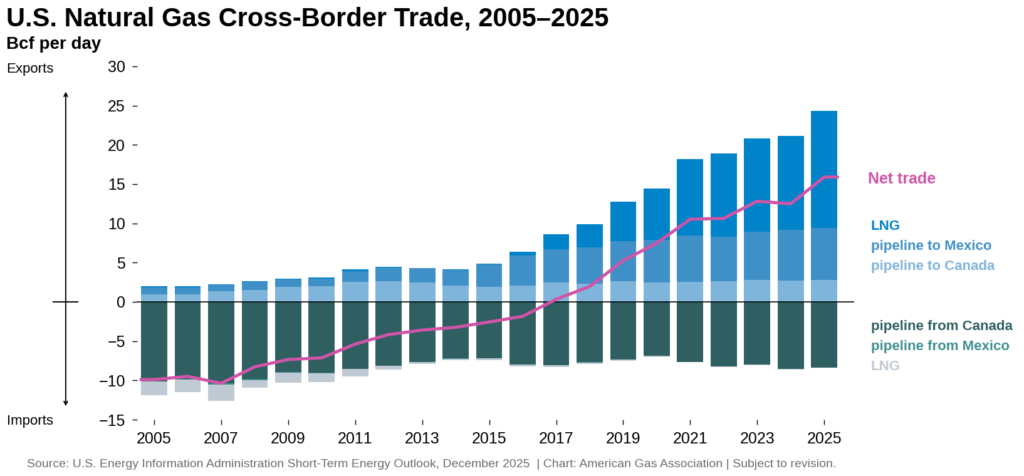
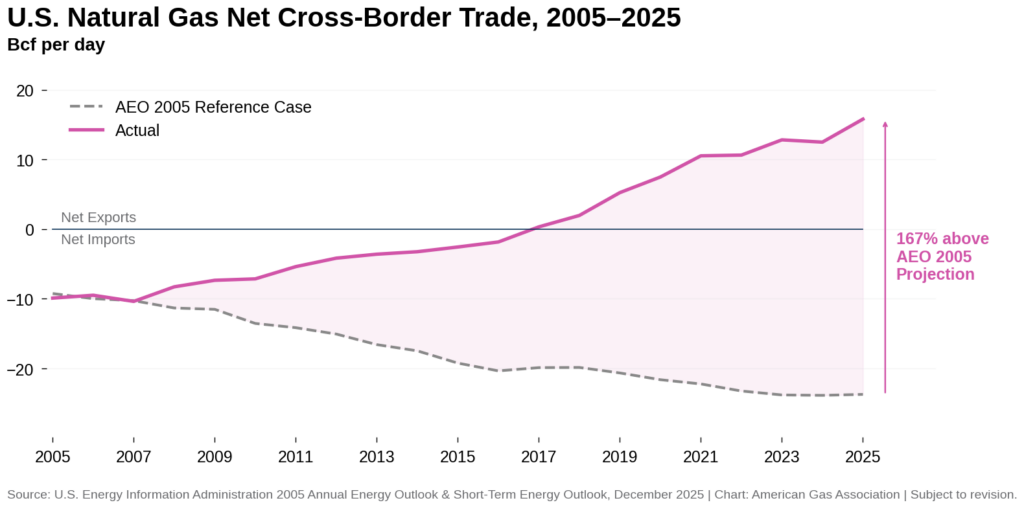
Prior to the Shale Revolution, the United States increasingly relied on natural gas imports to help meet domestic demand. At the time, analysts expected dependence on imports to deepen as demand was expected to grow, but domestic production was expected to stay flat or grow much more slowly. The 2005 AEO reference case showed that net imports averaged 9.2 Bcf per day in 2003 and were projected to more than double to 19.2 Bcf per day by 2015, rising to 23.7 Bcf per day by 2025. LNG was forecast to account for nearly 70 percent of gross imports in 2025, or about 17.4 Bcf per day.
Instead, net trade flows shifted from import to export, with net exports expected to reach nearly 16 Bcf per day per EIA’s December STEO, a 40 Bcf per day reversal from the 2005 AEO projection, reflecting the expansion of LNG export facilities and pipeline exports to Mexico.
At the time of the 2005 AEO, the initial wave of U.S. LNG facilities was intended as import terminals. The continental U.S. had four operating import terminals located at Everett, Massachusetts; Lake Charles, Louisiana; Elba Island, Georgia; and Cove Point, Maryland. There were also terminals at Kenai, Alaska, Peñuelas, Puerto Rico, and an offshore facility in the Gulf of Mexico. As of April 20, 2005, there were 41 active or proposed LNG import terminals across the U.S, including early-stage feasibility concepts.
Plans changed as natural gas production took off. Import terminals were repurposed for liquefaction and export. The same facilities that were intended to meet domestic demand would now satisfy growing global demand. Some LNG import facilities remained, including Everett and a handful of regasification sites in New England.
Net LNG trade turned positive in 2016. U.S. LNG became a net exporter of 0.3 Bcf per day after a decade of steady rebalancing from -1.6 Bcf per day in 2005 to -0.2 Bcf per day in 2015. Export growth then accelerated sharply, with net exports rising sevenfold from 1.7 Bcf per day in 2017 to roughly 12 Bcf per day in 2023 and 2024, making the U.S. the world’s largest LNG exporter. The EIA now projects LNG exports will reach approximately 15 Bcf per day in 2025.
As of December 2025, the Federal Energy Regulatory Commission (FERC) reports that nearly half of U.S. LNG import terminals are now also classified as export terminals. In total, FERC regulates ten operating onshore import terminals with 17.6 Bcf per day of regasification capacity. Five of those facilities—Sabine Pass, Freeport, Cameron, Cove Point, and Elba Island—have added liquefaction capabilities and operate as export terminals. Some import terminals are also authorized to re-export delivered LNG, regardless of liquefaction capabilities.
Pipeline trade over the last two decades has followed a similar trend.
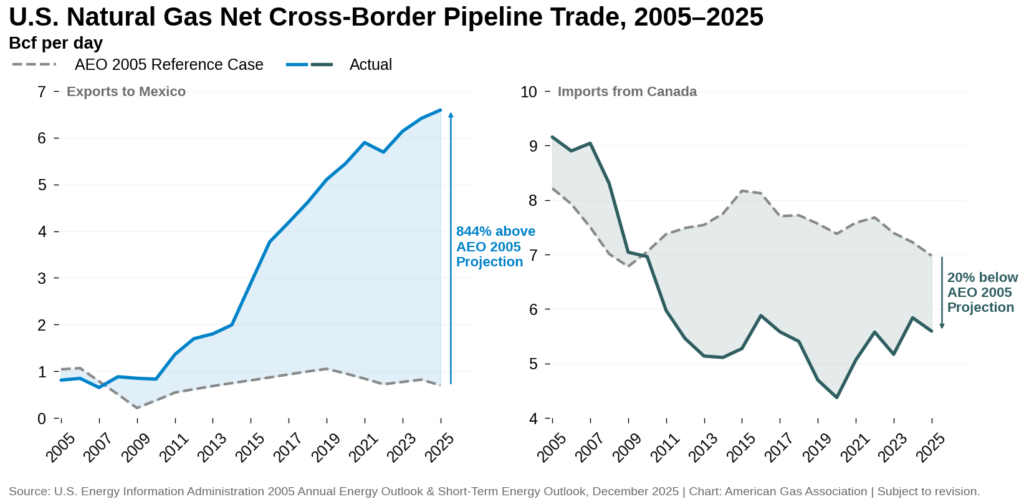
In 2005, pipeline exports to Mexico were a niche, peripheral story, and the prevailing view was that they would remain modest relative to the broader import-driven U.S. balance. Over time, however, Mexico-bound exports became a major source of incremental demand for the U.S., rising from about 0.8 Bcf per day in 2005 to roughly 6.6 Bcf per day in 2025. Today, U.S. natural gas supplies nearly three-quarters of Mexico’s domestic natural gas demand.
Meanwhile, pipeline imports from Canada moved in the opposite direction, falling sharply as domestic supply increased. While Canadian gas supply remains a vital component of the North American portfolio, the U.S. has become less reliant on Canadian imports compared to actual 2005 flows and the 2005 AEO projection. Net imports narrowed from about 9.2 Bcf per day in 2005 to roughly 5.6 Bcf per day in 2025, reflecting a 3.6 Bcf per day structural shift over the period, with little change since 2015.
Today, natural gas imports from Canada remain necessary for winter supply reliability, particularly for northern U.S. markets and states with limited or no domestic production. As a result, flows are generally between 3 and 7 Bcf per day, rising typically during major cold events.
U.S. Pipelines: Shifting Flows and Infrastructure Expansion
Changes in production, demand, and trade led to fundamental realignments of pipeline flows and new infrastructure in the lower 48. In 2005, the pipeline network reflected a system built around traditional northbound flows and regional handoffs, with the Northeast and Southeast structurally dependent on inflows, while the South Central and Mountain regions served as the system’s dominant outflow regions. The Northeast was a net inflow region, averaging -5.2 Bcf per day, and the Southeast was similarly inflow dependent at -4.9 Bcf per day.
By 2024, the network evolved to support larger interregional transfers, greater cross-border flexibility, and stronger southbound export capability. The most consequential change was the reversal of the Northeast’s net flow direction, which shifted from a net inflow in 2005 to a net outflow of +7.6 Bcf per day in 2024, a swing of nearly 13 Bcf per day, representing the largest net change across all interregional flows.
The Southeast increased its structural dependence on inflows over the same period, with net interregional flow balances declining from -4.9 Bcf per day in 2005 to -10.8 Bcf per day in 2024. In gross terms, this dependence is supported primarily by inflows from the South Central region, which remained the single largest regional flow over the last two decades (+11.8 Bcf per day in 2005 and +10.6 Bcf per day in 2024).
In absolute terms, the South Central region also remains the source of the largest net outflows, at +10.2 Bcf per day in 2024, though its surplus has narrowed relative to the +14.2 Bcf per day average in 2005. The same is true for the Mountain region, where net outflows fell from +11.8 Bcf per day in 2005 to +7.7. Bcf per day in 2024. This reduction in supply dominance across legacy producing regions reflects an interregional system characterized by a more balanced and distributed supply landscape rather than one anchored to a single dominant supply hub.
The 2005 AEO envisioned a markedly different long-run pipeline configuration shaped by higher prices, evolving Canadian supply dynamics, and major greenfield projects, including an Alaska natural gas pipeline slated for completion in 2016. The project was expected to boost Alaska production from 0.4 Tcf in 2003 to 2.2 Tcf in 2025, but it ultimately lost momentum as abundant lower 48 supply came online.
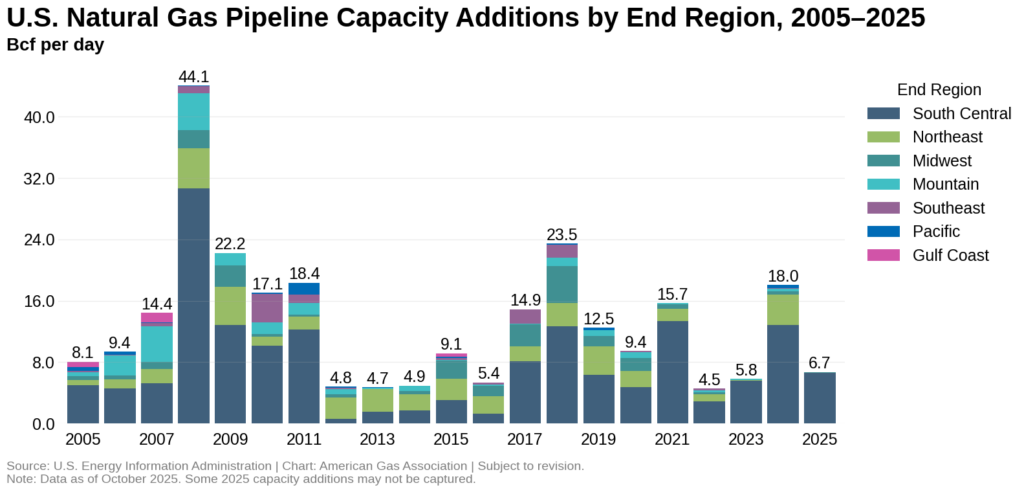
What did materialize, however, was pipeline capacity buildouts. Since 2005, pipeline capacity additions have averaged 13 Bcf per day annually, according to EIA data. Build activity peaked at 44.1 Bcf per day in 2008, driven by the rapid production growth brought about by the Shale Revolution. Most of this growth occurred in the South Central region, where several large basins—such as the Permian and Haynesville—and LNG export facilities are located. Since then, average annual additions have fallen to less than 12 Bcf per day, with the lowest annual addition of 4.5 Bcf per day reported in 2022.
Pipeline infrastructure remains critical for delivering natural gas from producing regions to end-use markets, supporting system reliability, enabling market access, and ensuring that growing demand from power generation, industrial users, and LNG exports can be met safely and efficiently.
Natural Gas Storage: Deliverability and Demand Don’t Keep Pace
Natural gas storage as a component of supply and a reliability measure is as important as ever. The dramatic growth in natural gas demand since 2005 has been met not only by rising production, but also by the vast natural gas storage system the U.S. has developed since the late 1800s. Yet as demand has surged over the past decade, maximum daily deliverability–the amount of gas that can be withdrawn from storage in a single day–has shrunk.
Starting in 2005, deliverability rose by about 41 percent between 2005 and 2014, and then largely stabilized at around 120 Bcf per day through 2020. Between 2020 and 2023, deliverability shrank by about 2 percent. As a result, the gap between peak daily demand and deliverability has widened substantially. In 2005, peak demand exceeded deliverability by 21.4 Bcf per day; by 2023, that gap had grown to more than 60 Bcf per day.
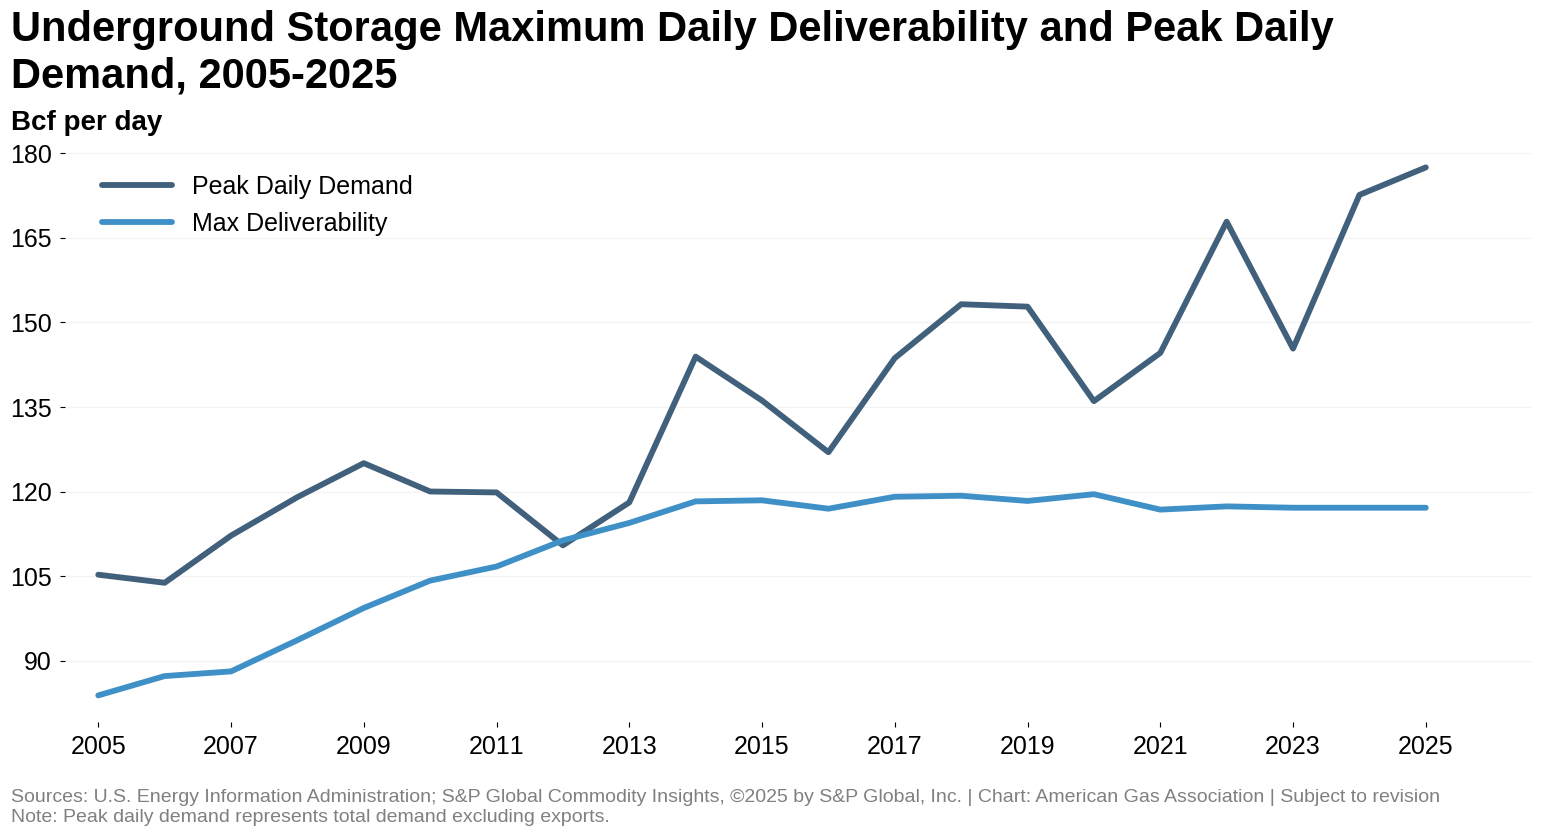
The chart reflects the most recent available EIA Form 191 data, which extends through 2023. Values for 2024 and 2025 assume deliverability remains flat at 2023 levels, consistent with the methodology used in the AGA’s Assessing the Value of Natural Gas Storage report.
Final Note
Thank you for your continued support of the Natural Gas Market Indicators. We hope you find the information and analysis informative and helpful for your work, and look forward to sharing insights in future editions.
For questions please contact Juan Alvarado | jalvarado@aga.org, Liz Pardue | lpardue@aga.org, or
Lauren Scott | lscott@aga.org
To be added to the distribution list for this report, please notify Lucy Castaneda-Land | lcastaneda-land@aga.org
NOTICE
In issuing and making this publication available, AGA is not undertaking to render professional or other services for or on behalf of any person or entity. Nor is AGA undertaking to perform any duty owed by any person or entity to someone else. Anyone using this document should rely on his or her own independent judgment or, as appropriate, seek the advice of a competent professional in determining the exercise of reasonable care in any given circumstances. The statements in this publication are for general information and represent an unaudited compilation of statistical information that could contain coding or processing errors. AGA makes no warranties, express or implied, nor representations about the accuracy of the information in the publication or its appropriateness for any given purpose or situation. This publication shall not be construed as including advice, guidance, or recommendations to take, or not to take, any actions or decisions regarding any matter, including, without limitation, relating to investments or the purchase or sale of any securities, shares or other assets of any kind. Should you take any such action or decision; you do so at your own risk. Information on the topics covered by this publication may be available from other sources, which the user may wish to consult for additional views or information not covered by this publication.
Copyright © 2026 American Gas Association. All rights reserved.