Natural Gas Market Indicators – 501st Edition
Natural Gas Market Summary
Extreme cold is expected in the coming days across much of the northern and eastern U.S. The multi-wave Arctic outbreak is likely to sustain below-normal temperatures across the Central and Eastern U.S., driving up demand for natural gas and electricity. Dr. Ryan Maue of Weather Trader reported that “potentially catastrophic winter weather” could affect much of the eastern U.S. into the weekend, with Saturday temperatures near and below minus 20°F expected across the Midwest and Great Lakes. Looking at market conditions, natural gas supplies this week appear robust, with production up year over year and storage inventories above both year-ago levels and the five-year average. Canadian imports are rising ahead of the cold, even as the Arctic cold arrives first in the north. The Market Indicators team is monitoring these developments closely and will provide updates as conditions evolve and material market impacts emerge.

NGMI 501: Looking to the Future
In the 500th edition of the Natural Gas Market Indicators (NGMI), the Market Indicators team looked back at how the natural gas market has changed over the last twenty years. With the 501st, we look forward: where might the market be headed as it considers issues of reliability, demand growth, LNG markets, energy security, new infrastructure requirements, and more?
This edition relies on two main sources for near-term projections: the U.S. Energy Information Administration (EIA) and Rystad Energy. Annual projections are presented as ranges and midpoints to reflect prevailing expectations. Select monthly charts provide additional detail on near-term projections. As with any projection, these outlooks are subject to change. Unforeseen changes and new information may alter outcomes over time. Nevertheless, today’s expectations offer valuable insight into near-term market sentiment and potential system dynamics.
Natural Gas Price Projections: Shifting Expectations at the Henry Hub
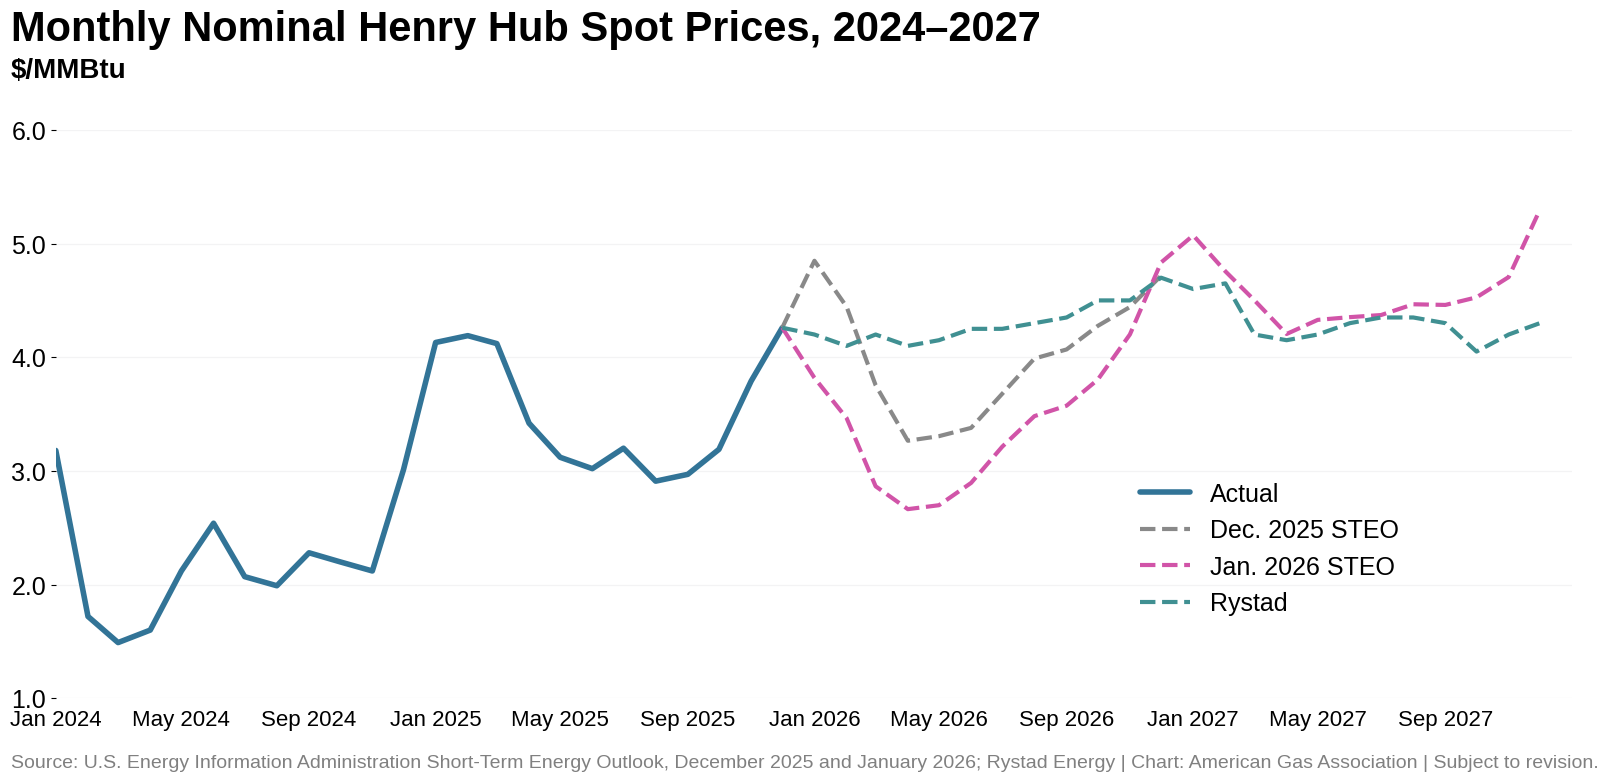
Henry Hub prices finished 2025 above 2024 levels but within historic averages, yet forecasts for the years ahead are mixed. While near-term expectations have been revised sharply in recent months, longer-term projections indicate widening uncertainty around annual outcomes.
After reaching historic lows in 2024, nominal Henry Hub spot prices averaged $3.53 per MMBtu in 2025, according to the EIA, up about 61 percent from the prior year but within the historic range. The spot price closed the year at $4.26 per MMBtu in December 2025.
In the January 2026 STEO, the EIA forecasts natural gas spot prices to drop this year, cutting the annual average price projection to $3.46 per MMBtu, nearly 14 percent below the prior estimate. In fact, it’s the first forecast for 2026 to show a decline from 2025—each of EIA’s outlooks last year showed spot prices rising from 2025 to 2026. The downward revision in EIA’s 2026 price projection is concentrated in the first quarter of 2026 and reflects expectations for milder winter temperatures, which would reduce heating demand and near-term price pressure. EIA projects monthly spot prices to rise toward the end of 2026, with a projected high of around $4.80 per MMBtu in December 2026, driven by a tightening supply-demand balance.
By comparison, Rystad Energy’s December 2025 outlook expects an average price of $4.30 per MMBtu for 2026, with 2027 prices largely remaining flat. This corresponds fairly closely to the EIA’s January 2026 STEO projection for 2027 of nearly $4.60 per MMBtu.
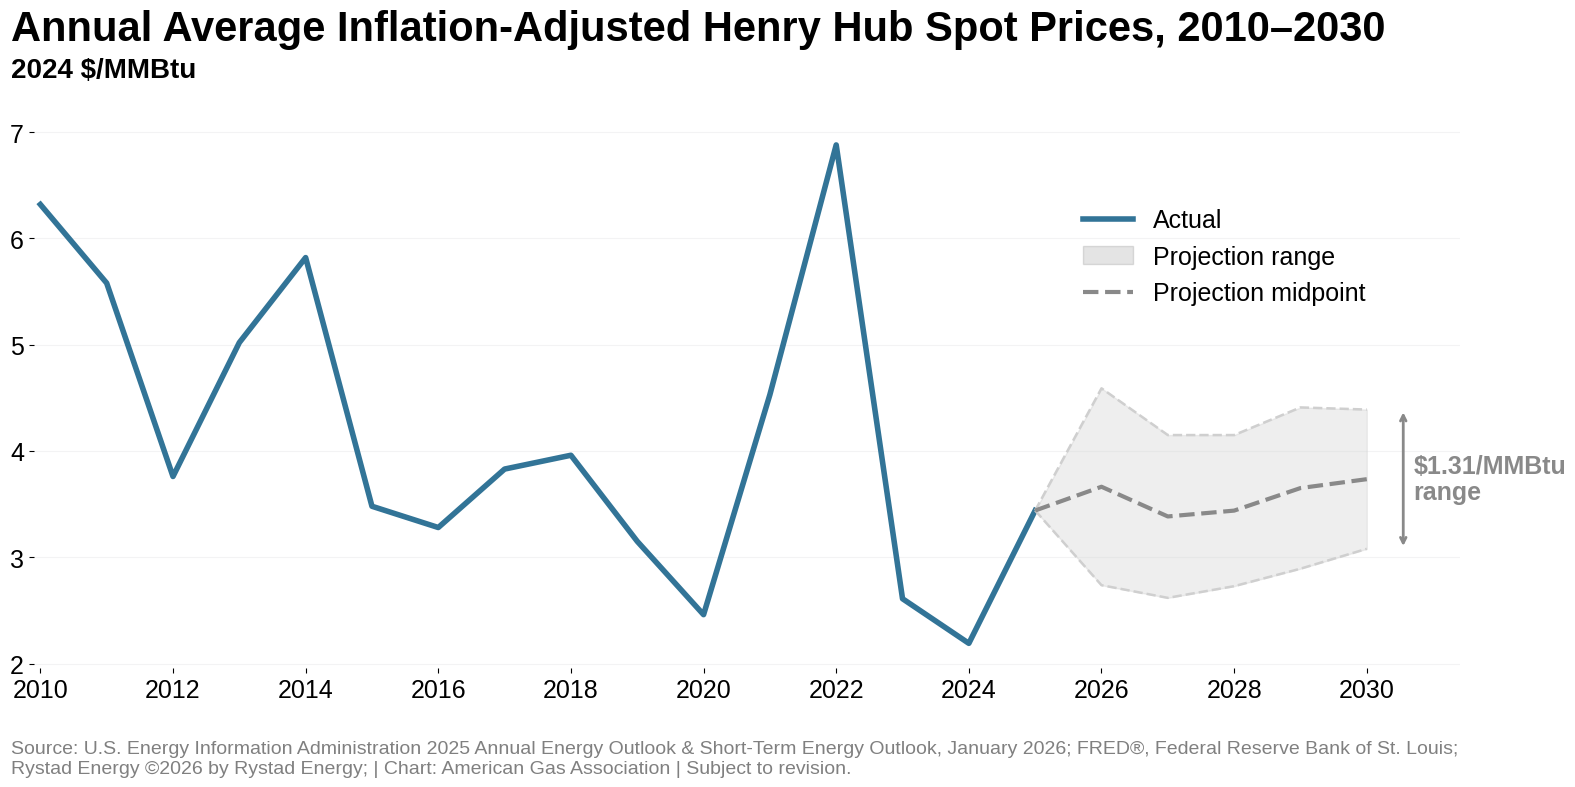
Through the end of the decade, projections point to a wider range of possible outcomes rather than a clear directional shift in prices, but annual inflation-adjusted estimates remain under $5 per MMBtu. The projection range widens most notably in 2026, when the spread between the highest and lowest estimates reaches roughly $1.85 per MMBtu, likely reflecting timing differences across the outlooks. Projected annual midpoints beyond 2026 remain relatively stable, hovering near $3.40 per MMBtu in 2027 and gradually rising to about $3.70 per MMBtu in 2030.
Dry Natural Gas Production: Onward and Upward
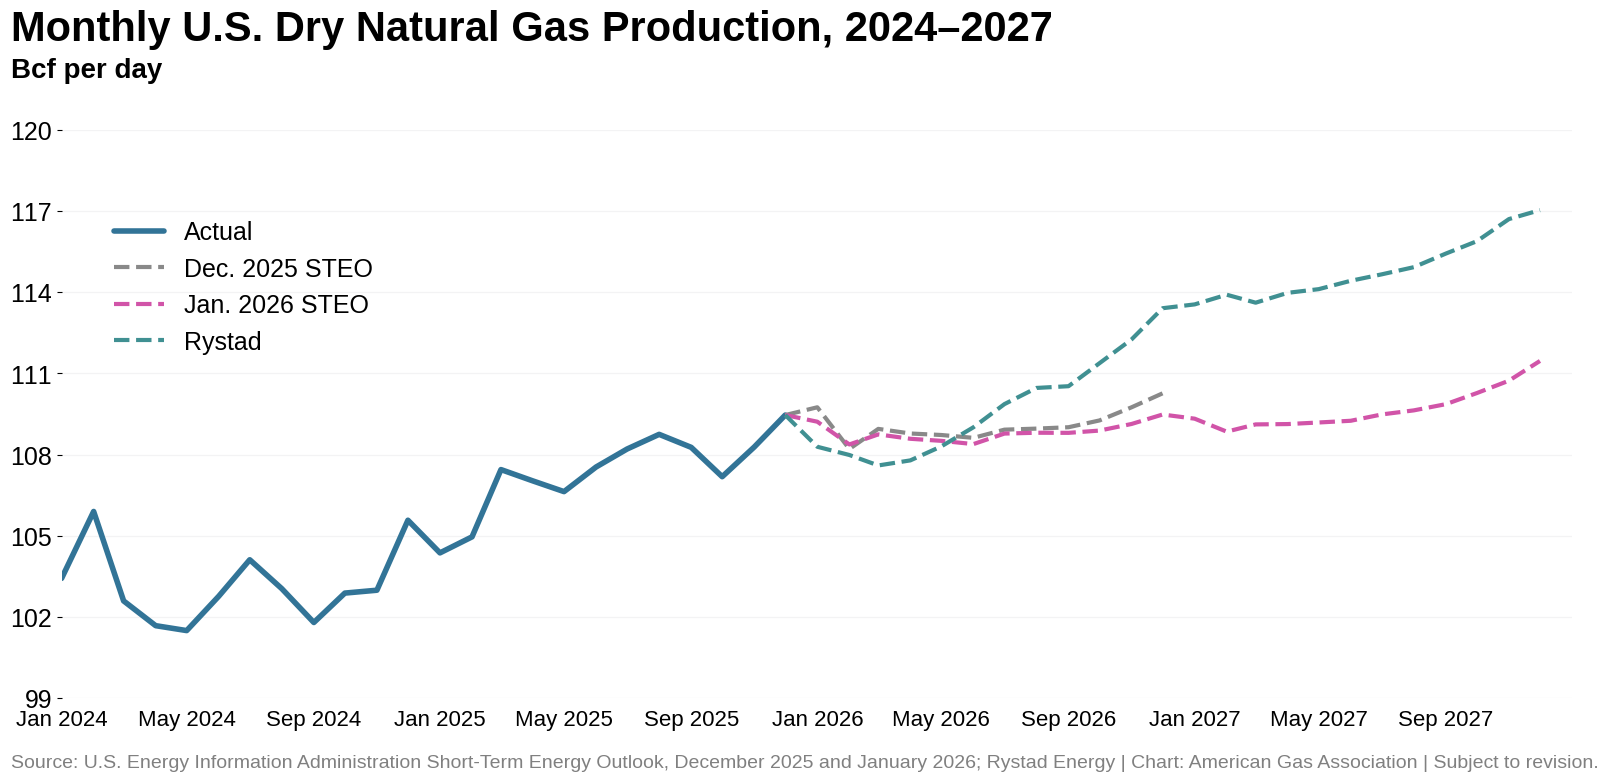
Across the board, current outlooks expect U.S. dry natural gas production to continue to grow through the end of the decade. While EIA projections point to relatively modest growth over the next two years, Rystad Energy anticipates a more aggressive production ramp through 2027. By December 2027, the gap between outlooks reaches about 5.6 Bcf per day, highlighting growing uncertainty around how quickly supply responds to market conditions. Measured against December 2025 production of roughly 109.5 Bcf per day, Rystad Energy’s outlook implies an increase of about 6.9 percent, compared with a roughly 1.8 percent increase under EIA’s projection. Together, the forecasts suggest that while production is expected to continue rising, the pace of that growth remains uncertain.
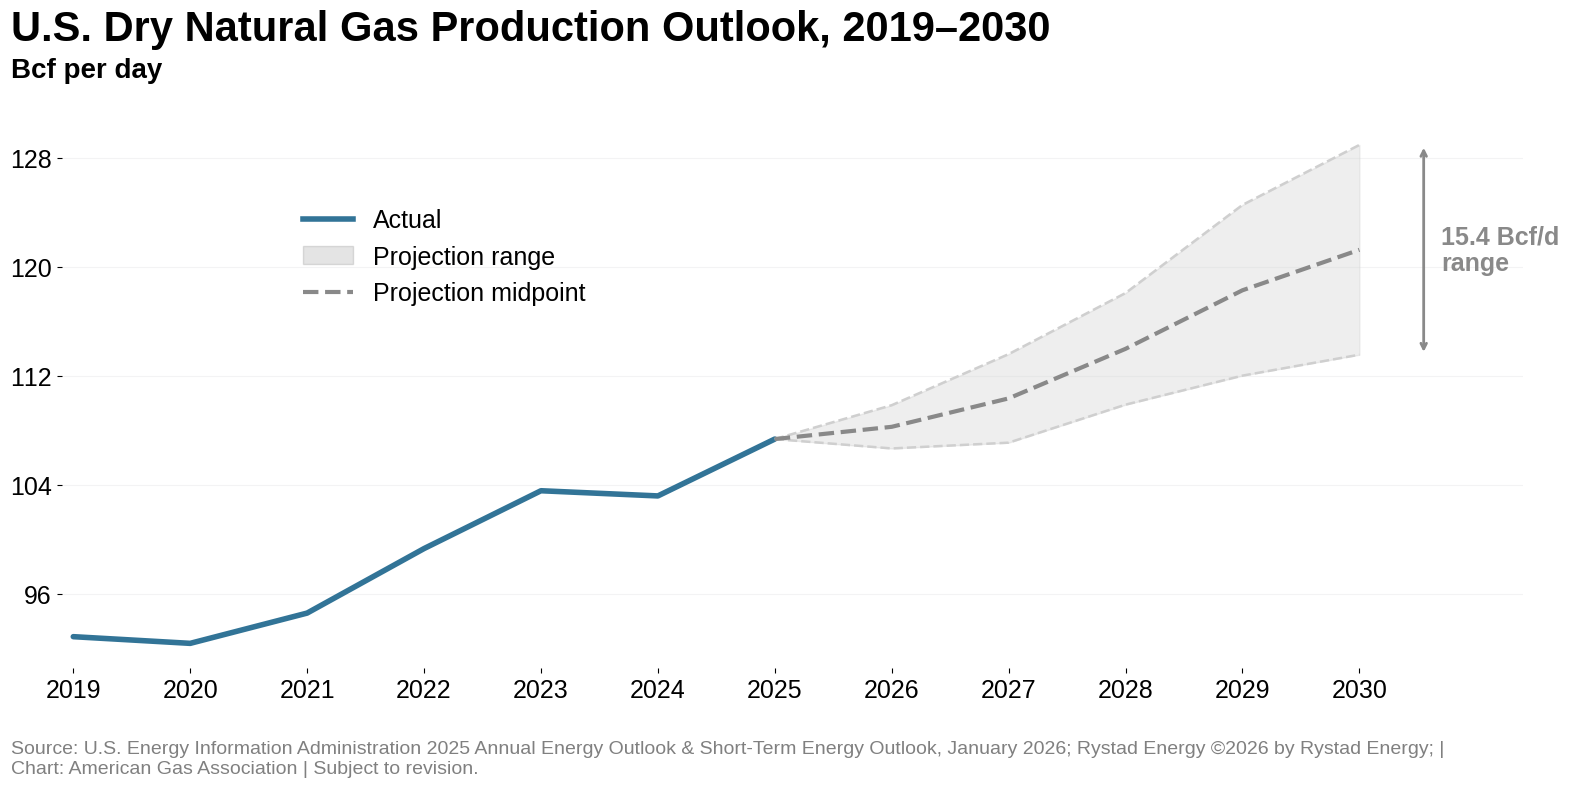
U.S. dry natural gas production averaged more than 107 Bcf per day in 2025, reflecting a historically strong supply base. Looking ahead, projections indicate continued growth in domestic production through the end of the decade. While individual outlooks differ on the pace of that increase, the midpoint of projections suggests production in 2030 could be roughly 13 percent higher than 2025 levels at around 121 Bcf per day. Taken together, the forecasts indicate steady expansion rather than a step-change in supply, with growth expected to unfold gradually over the coming years.
U.S. Natural Gas Demand: Power Sector Assumptions Driving Projections
By 2030, U.S. domestic natural gas consumption is expected to reach approximately 84 Bcf per day, with estimates ranging from around 80 to 88 Bcf per day. Across the two sources examined, the EIA’s 2025 AEO projection implies that demand will decline by 1 percent over the next half decade, while Rystad Energy projects a 6.5 percent increase. That spread reflects varying assumptions about weather normalization, macroeconomic activity, and—perhaps most significantly—the electric power grid’s generation mix.
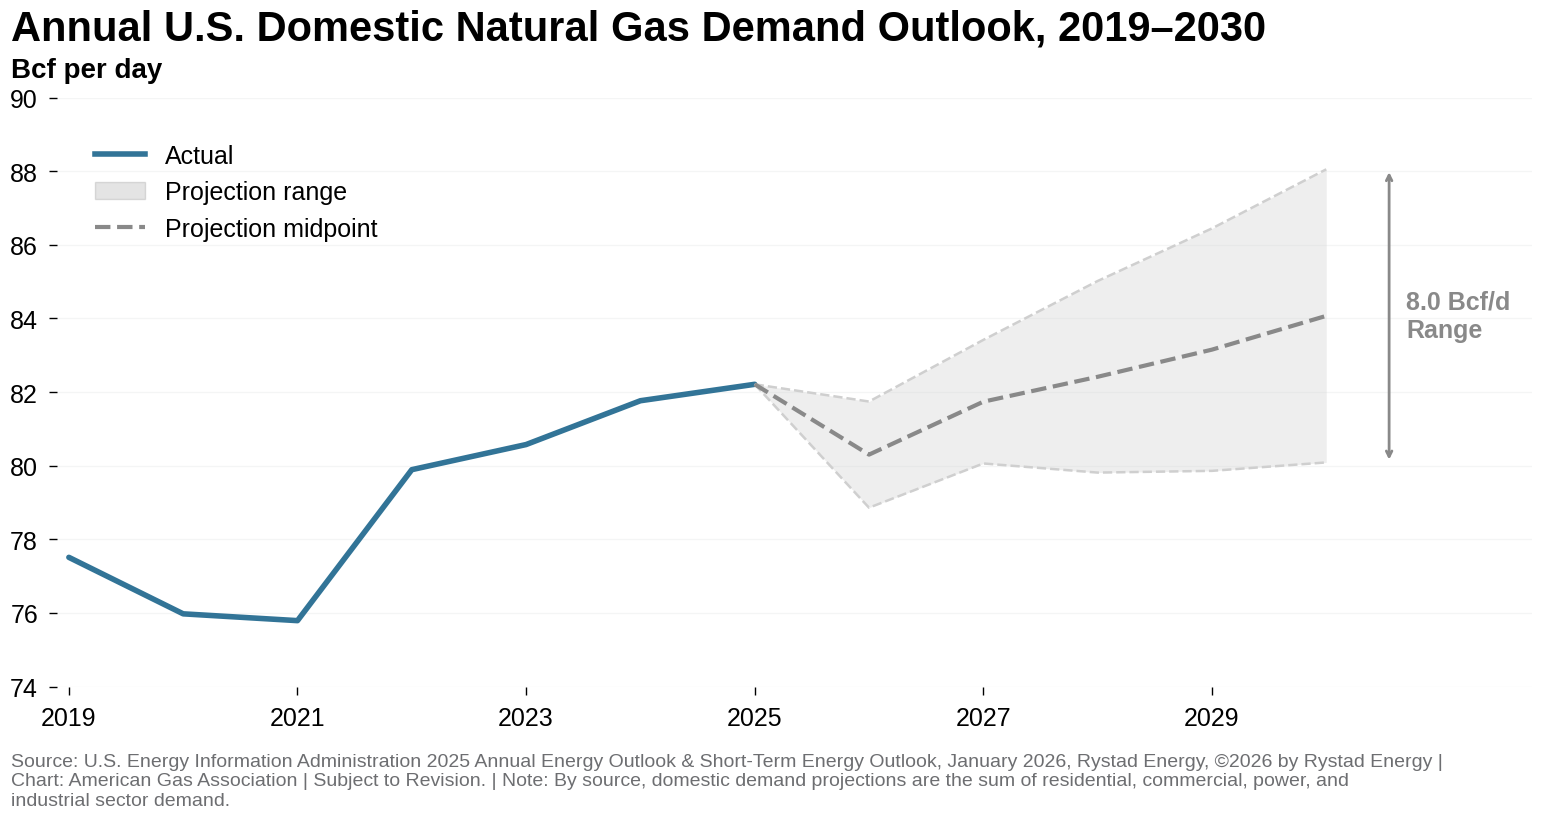
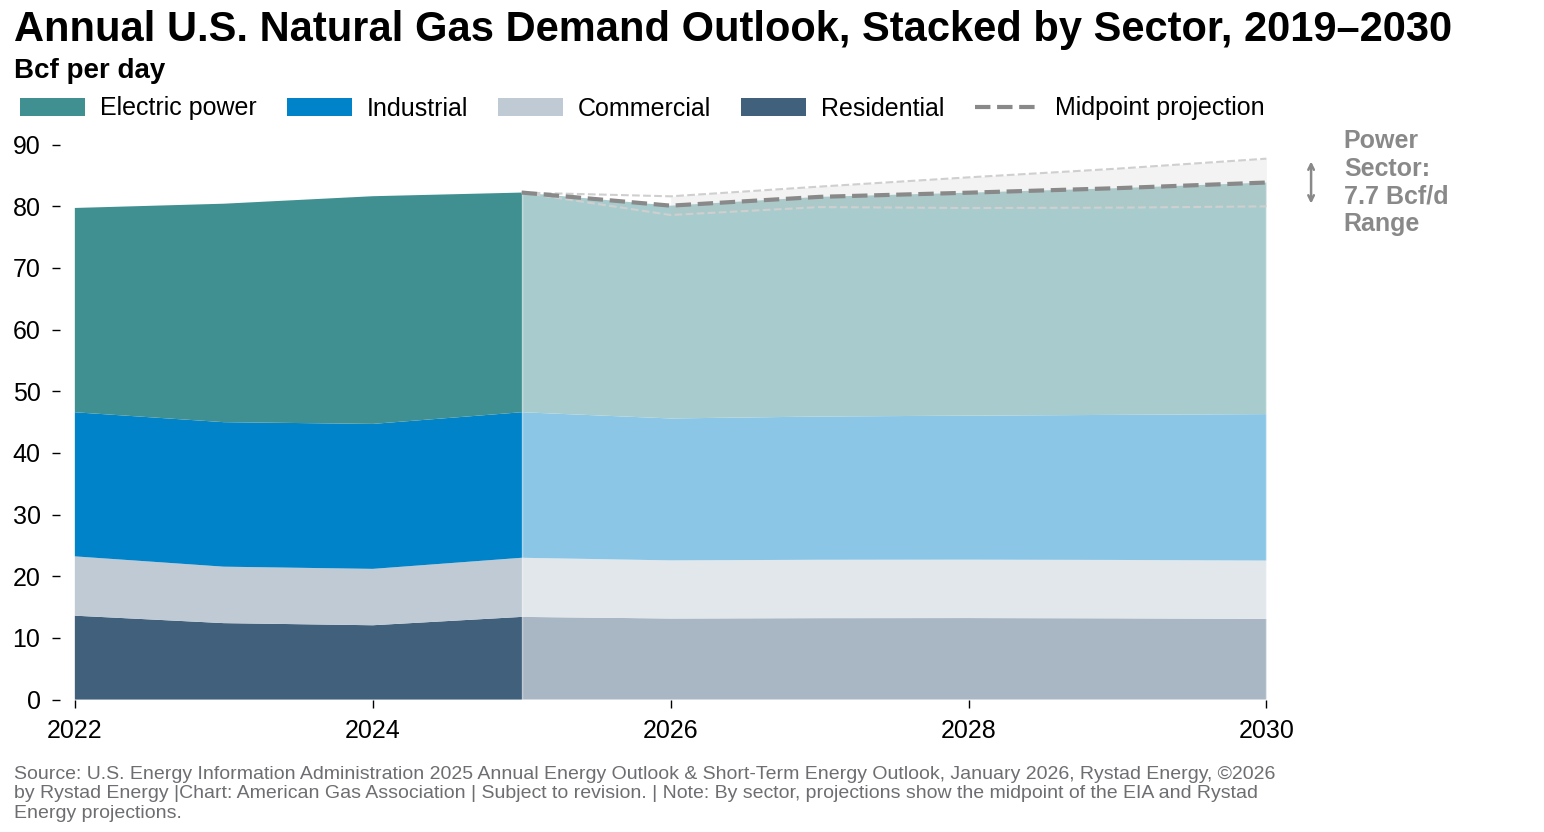
In fact, the electric power sector alone accounts for nearly 80 percent of the total divergence between the projection cases across the 2025 to 2030 window. By comparison, the industrial sector accounts for roughly 12 percent of the total spread between domestic demand outlooks, the residential sector about 7 percent, and the commercial sector approximately 6 percent.
Projections offer very different outlooks for natural gas growth in the power sector over the coming years, with Rystad Energy anticipating an 18 percent increase in power-sector consumption between 2025 and 2030, while the EIA projects a 3 percent decline over this period.
Importantly, the distinction across electric power sector forecasts is not simply “more load versus less load,” but how the system meets incremental demand and reliability requirements. With the continued expansion of data centers, manufacturing growth, new consumers and end-uses, and possible continued coal-to-gas switching, variance largely comes down to four questions:
- Which resources will fill that gap, particularly the balance between natural gas, coal, renewables, and other firm capacity options?
- How much incremental capacity will be required to meet new demand?
- How quickly can new generation realistically be permitted, financed, and brought online within the next five years?
- How efficient will that new capacity be, and how intensively will it be dispatched?
U.S. Trade: Export Dominance Expected to Continue into 2030
Across the EIA and Rystad Energy outlooks, U.S. net cross-border exports are projected to rise steadily through 2030. The midpoint projection implies a 42 percent increase in net annual natural gas exports between 2026 and 2030. By 2030, net export projections range from approximately 23 Bcf per day in the EIA’s 2025 AEO to roughly 27 Bcf per day in Rystad Energy’s outlook, a spread of nearly 7 Bcf per day, more than four times 2019 net export levels.
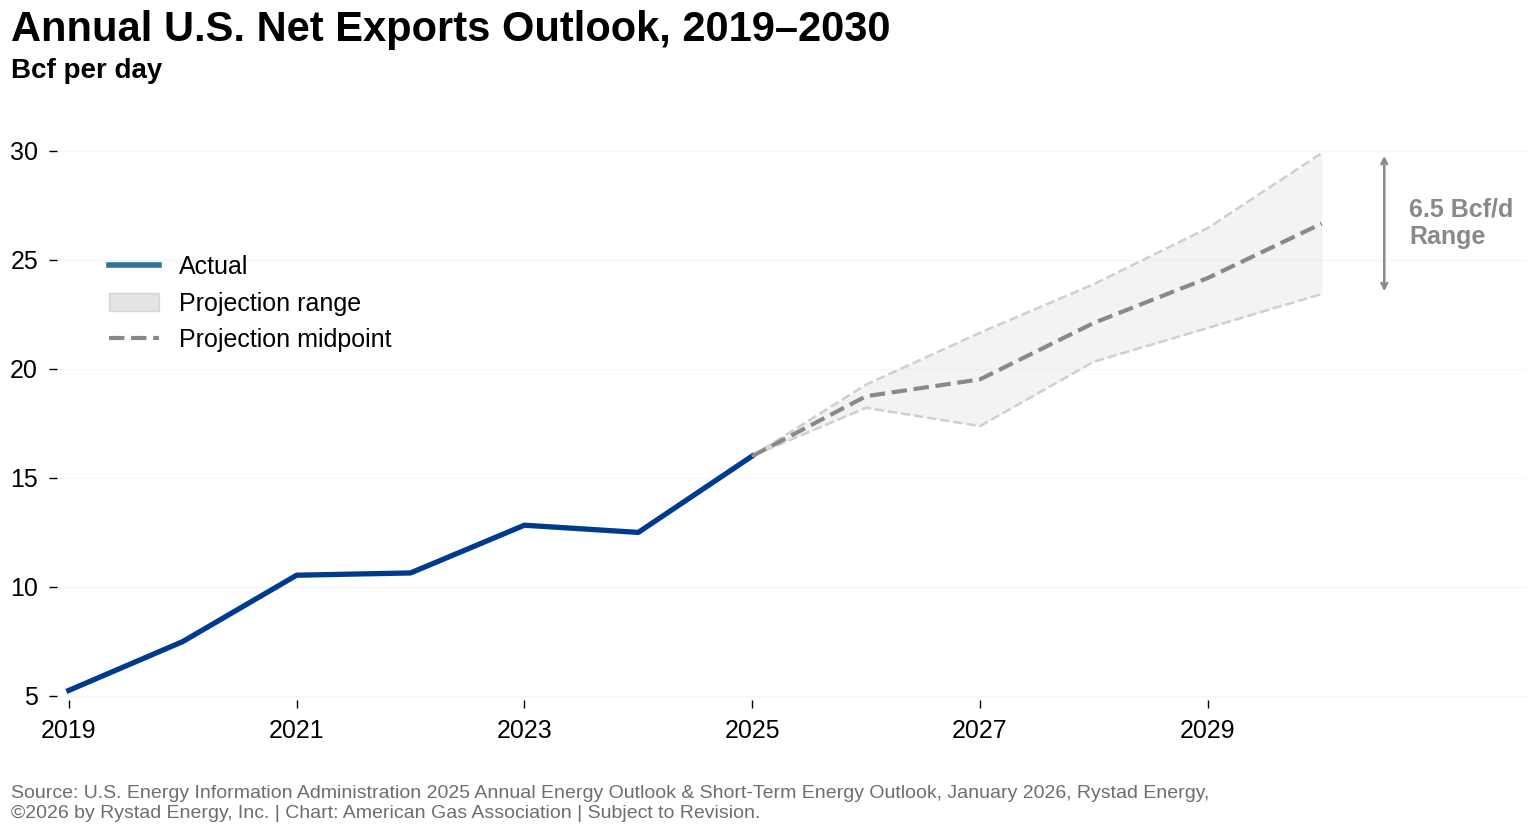
Liquefied natural gas is the primary driver of forecast growth and case-to-case variation across U.S. natural gas trade outlooks. Over the past two decades, new and expanding domestic supply has enabled a rapid buildout of LNG export capacity. With roughly 3,900 Tcf of technically recoverable reserves, continued advances in production and siting, and additional LNG export projects moving forward, growth is expected to remain strong over the next five years. Net LNG export volumes are projected to rise by roughly 47 percent to 57 percent between 2026 and 2030.
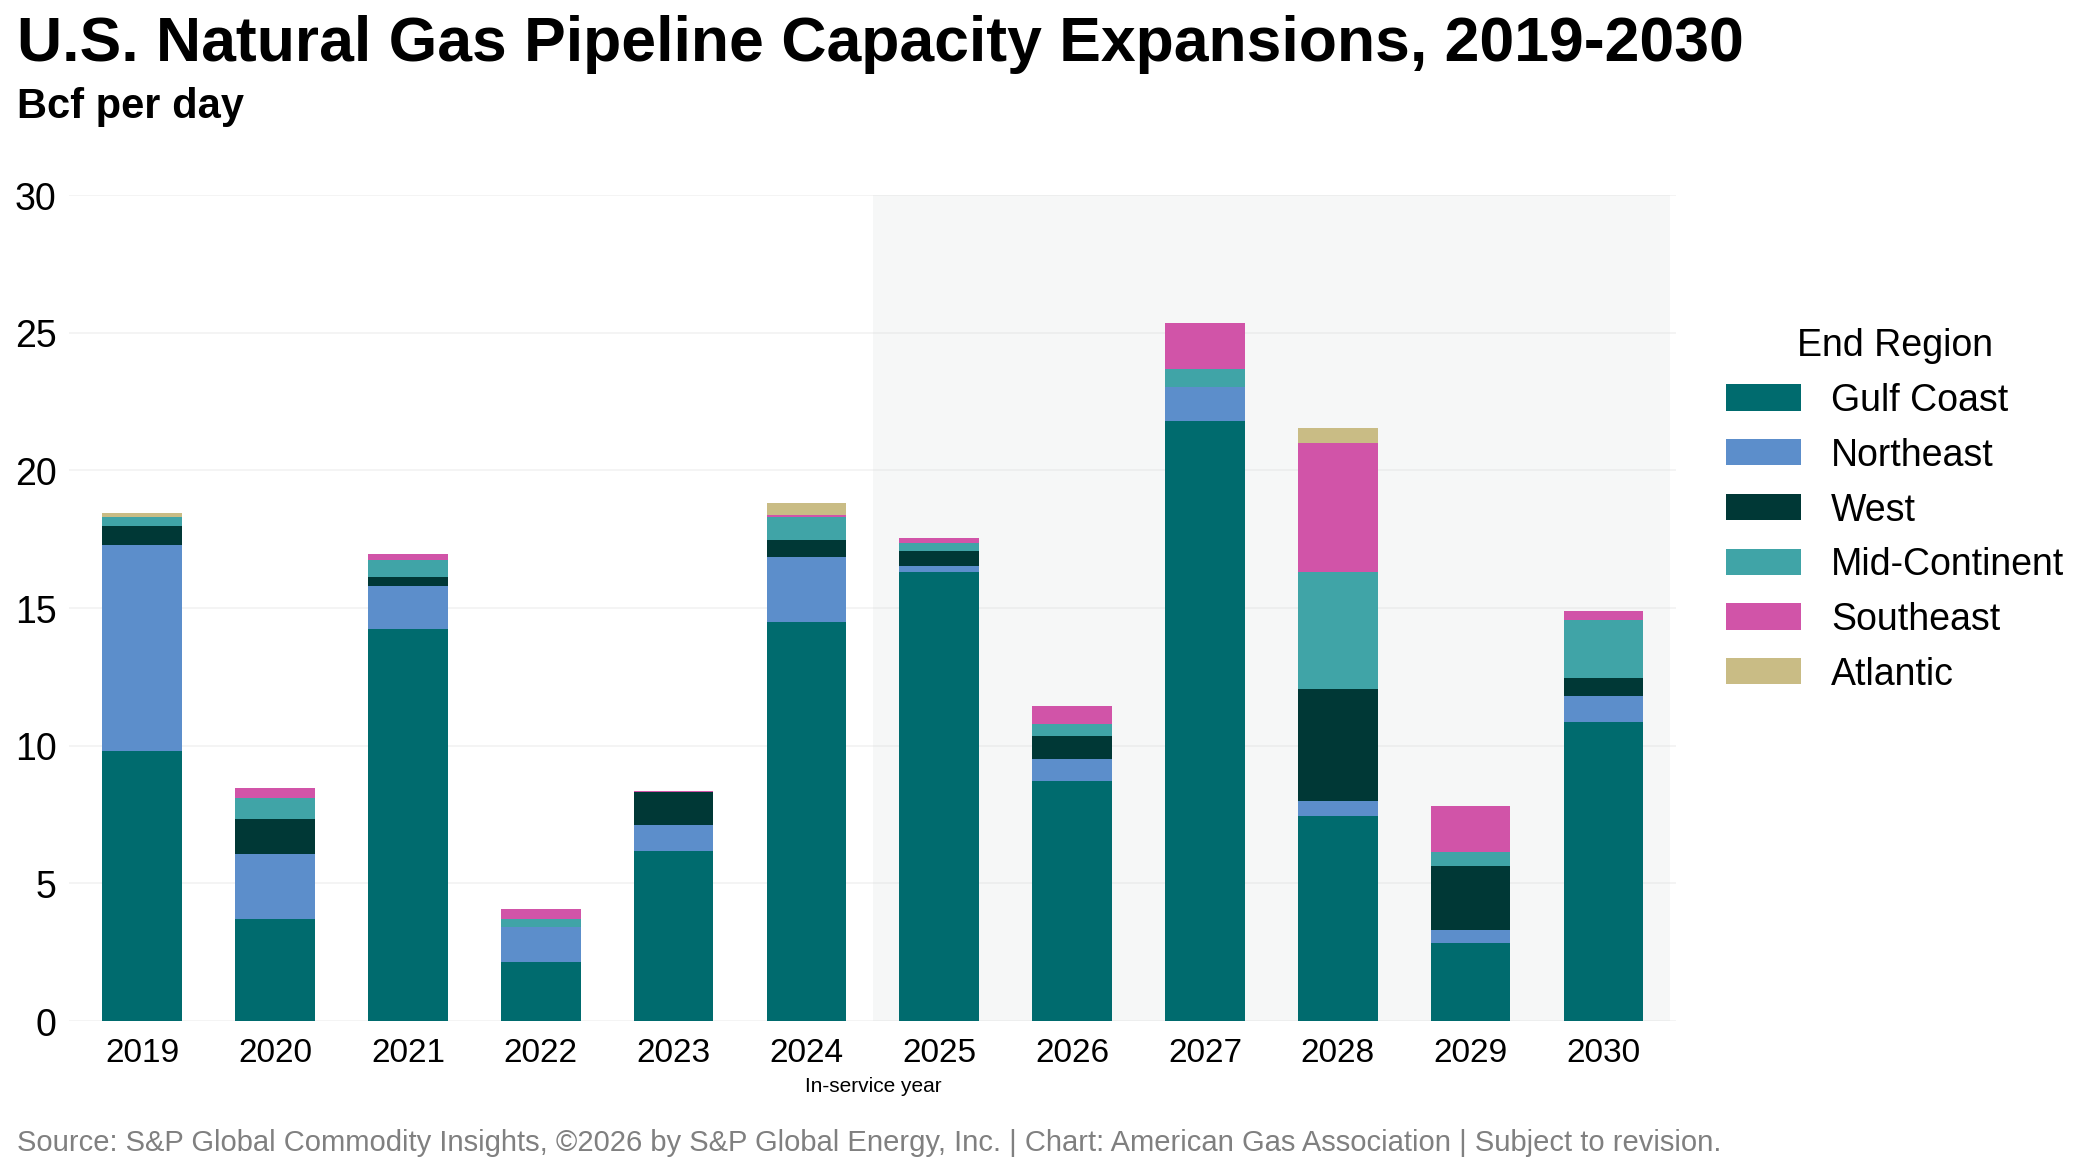
Natural Gas Infrastructure Expansion: Gulf Coast Momentum
According to the EIA, U.S. LNG export capacity is expected to increase nearly 14 Bcf per day between 2025 and 2029. All the expansion is planned along the Gulf Coast in Louisiana and Texas. In 2025, the U.S. remained the world’s largest LNG exporter, with cumulative baseload nameplate capacity reaching 15.4 Bcf per day.
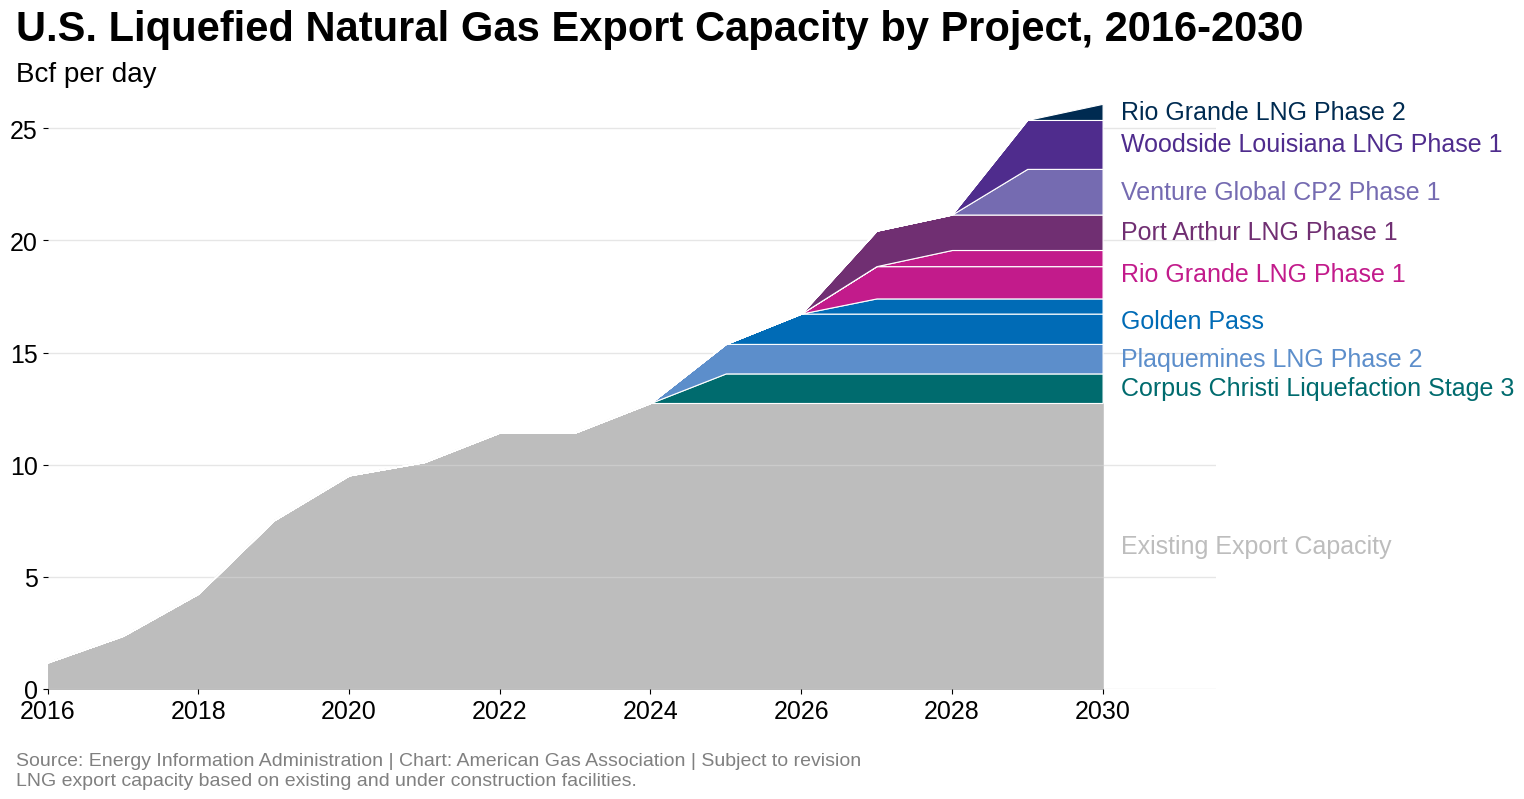
Expected pipeline capacity additions remain heavily concentrated along the Gulf Coast, which has been the dominant destination for new pipeline infrastructure since 2017. In 2025 alone, nearly 93 percent of total pipeline capacity expansions had endpoints in the Gulf Coast, underscoring the region’s central role in supporting LNG exports, industrial demand, and downstream market access. Looking ahead to the 2026 to 2030 period, the Gulf Coast is still expected to account for the majority of new capacity, making up roughly 64 percent of total buildout. Outside the Gulf Coast, projected expansions are more modest, with the Southeast and Midcontinent emerging as the next largest contributors, accounting for about 11 percent and 10 percent of expected capacity additions, respectively, through the end of the decade.
Final Note
The Market Indicators team thanks you for following this two-part series examining the past and future of the natural gas market. We look forward to returning to our regular format soon. In the meantime, we are closely monitoring evolving winter conditions and will update readers as material developments emerge, continuing our commitment to timely, data-driven market analysis.
For questions please contact Juan Alvarado | jalvarado@aga.org, Liz Pardue | lpardue@aga.org, or
Lauren Scott | lscott@aga.org
To be added to the distribution list for this report, please notify Lucy Castaneda-Land | lcastaneda-land@aga.org
NOTICE
In issuing and making this publication available, AGA is not undertaking to render professional or other services for or on behalf of any person or entity. Nor is AGA undertaking to perform any duty owed by any person or entity to someone else. Anyone using this document should rely on his or her own independent judgment or, as appropriate, seek the advice of a competent professional in determining the exercise of reasonable care in any given circumstances. The statements in this publication are for general information and represent an unaudited compilation of statistical information that could contain coding or processing errors. AGA makes no warranties, express or implied, nor representations about the accuracy of the information in the publication or its appropriateness for any given purpose or situation. This publication shall not be construed as including advice, guidance, or recommendations to take, or not to take, any actions or decisions regarding any matter, including, without limitation, relating to investments or the purchase or sale of any securities, shares or other assets of any kind. Should you take any such action or decision; you do so at your own risk. Information on the topics covered by this publication may be available from other sources, which the user may wish to consult for additional views or information not covered by this publication.
Copyright © 2026 American Gas Association. All rights reserved.