Natural Gas Market Indicators – February 5, 2026
Natural Gas Market Summary
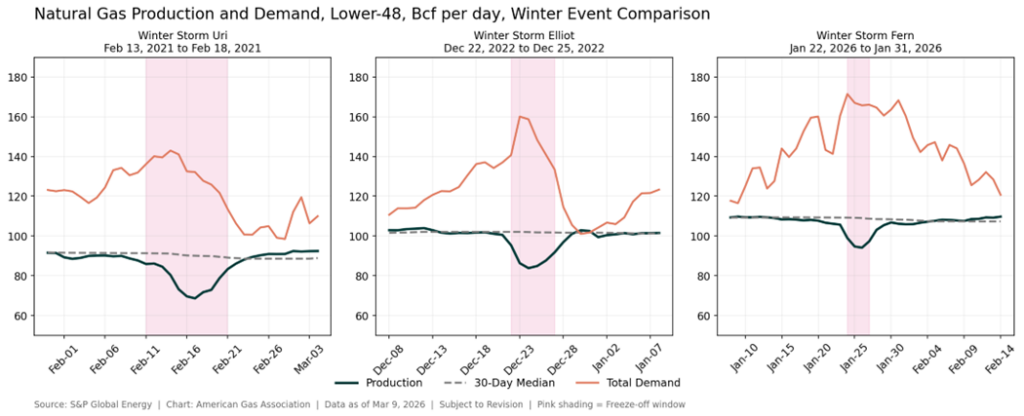
Much of the modern U.S. natural gas system is built to meet consumer energy requirements during the coldest conditions. The inherent resilience and reliability were showcased in the last couple of weeks as extreme cold winter conditions and multiple storms descended upon the eastern U.S. The January 2026 Winter Storm Fern produced the highest seven-day rolling average of total natural gas demand on record at 165.6 Bcf per day, starting on January 24 and ending on January 30, according to data from S&P Global Energy. Residential, commercial, electric power, and industrial consumption all spiked near-record daily highs. Natural gas was the primary source of electricity in most of America during the storm, with many regional grids relying on it as the primary or secondary energy source for peak hourly and daily generation.
The storm event also saw record storage withdrawals, the highest Canadian imports in nearly two decades, a decline in LNG feedgas demand for export, and an 13 percent drop in production that reflected declines in largely oil-producing regions. Despite the drop in production, flowing gas declined less than in other major storms, notably Winter Storms Uri (2021) and Elliot (2022). Commodity prices spiked during the event, with spot prices rising briefly but sharply, and futures prices climbing as the February contracts rolled into March. However, futures prices have since retreated, which may signal that the market sees sufficient supplies coming out of this winter event to meet growing demand.
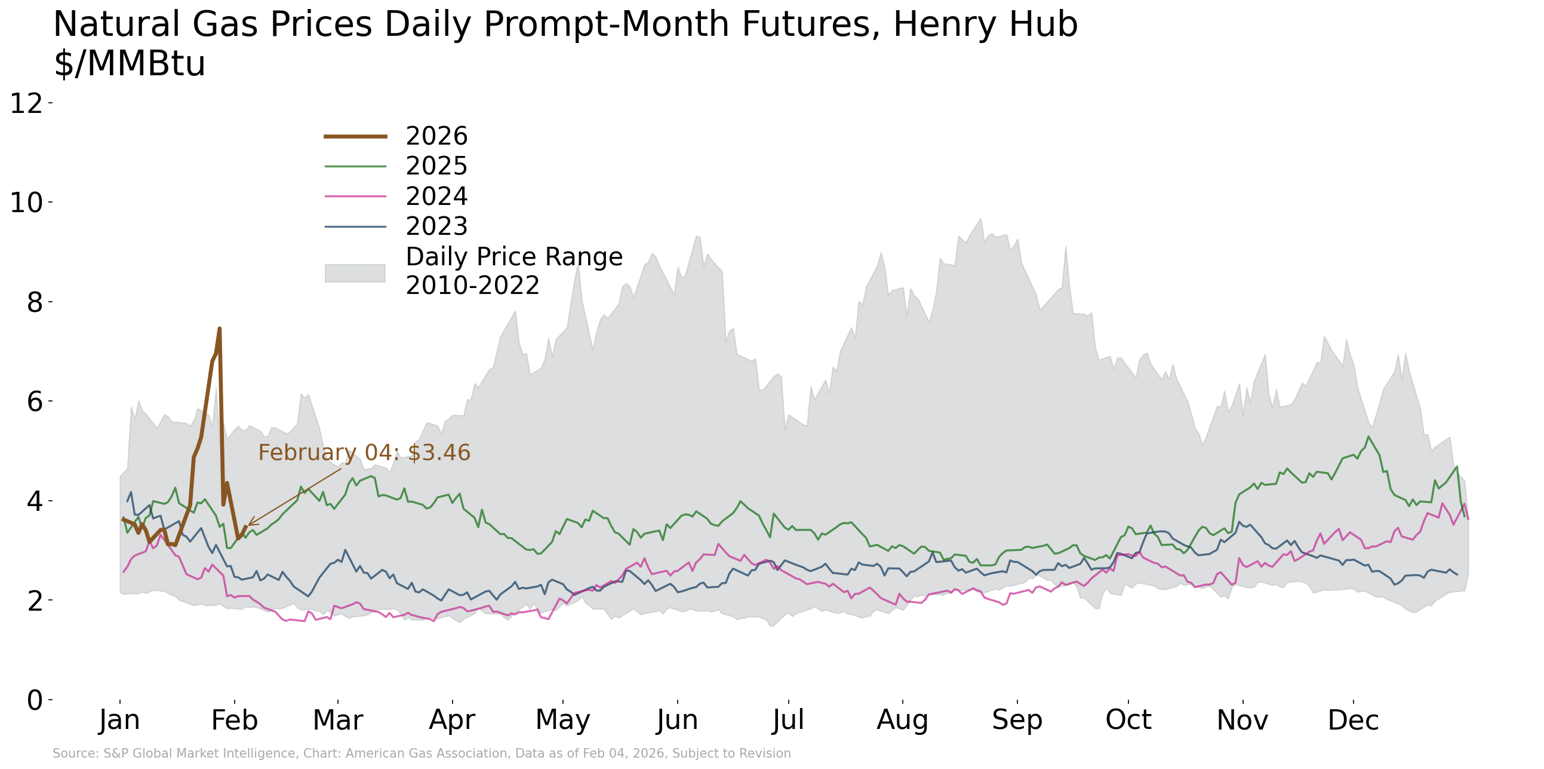
Prompt Month Prices Rise Briefly, But Retreat in February
February 2026 futures prices began the year below $4.00 per MMBtu, with the prompt-month contract exceeding $4.00 on only six trading days in January. However, as Fern approached, February contracts and prices across the 12-month strip spiked as high as $7.46 per MMBtu before the prompt-month contract rolled over into March, at which point prices fell sharply to under $4.00 per MMBtu. As of February 4, the March 2026 futures contract settled at $3.46 per MMBtu.
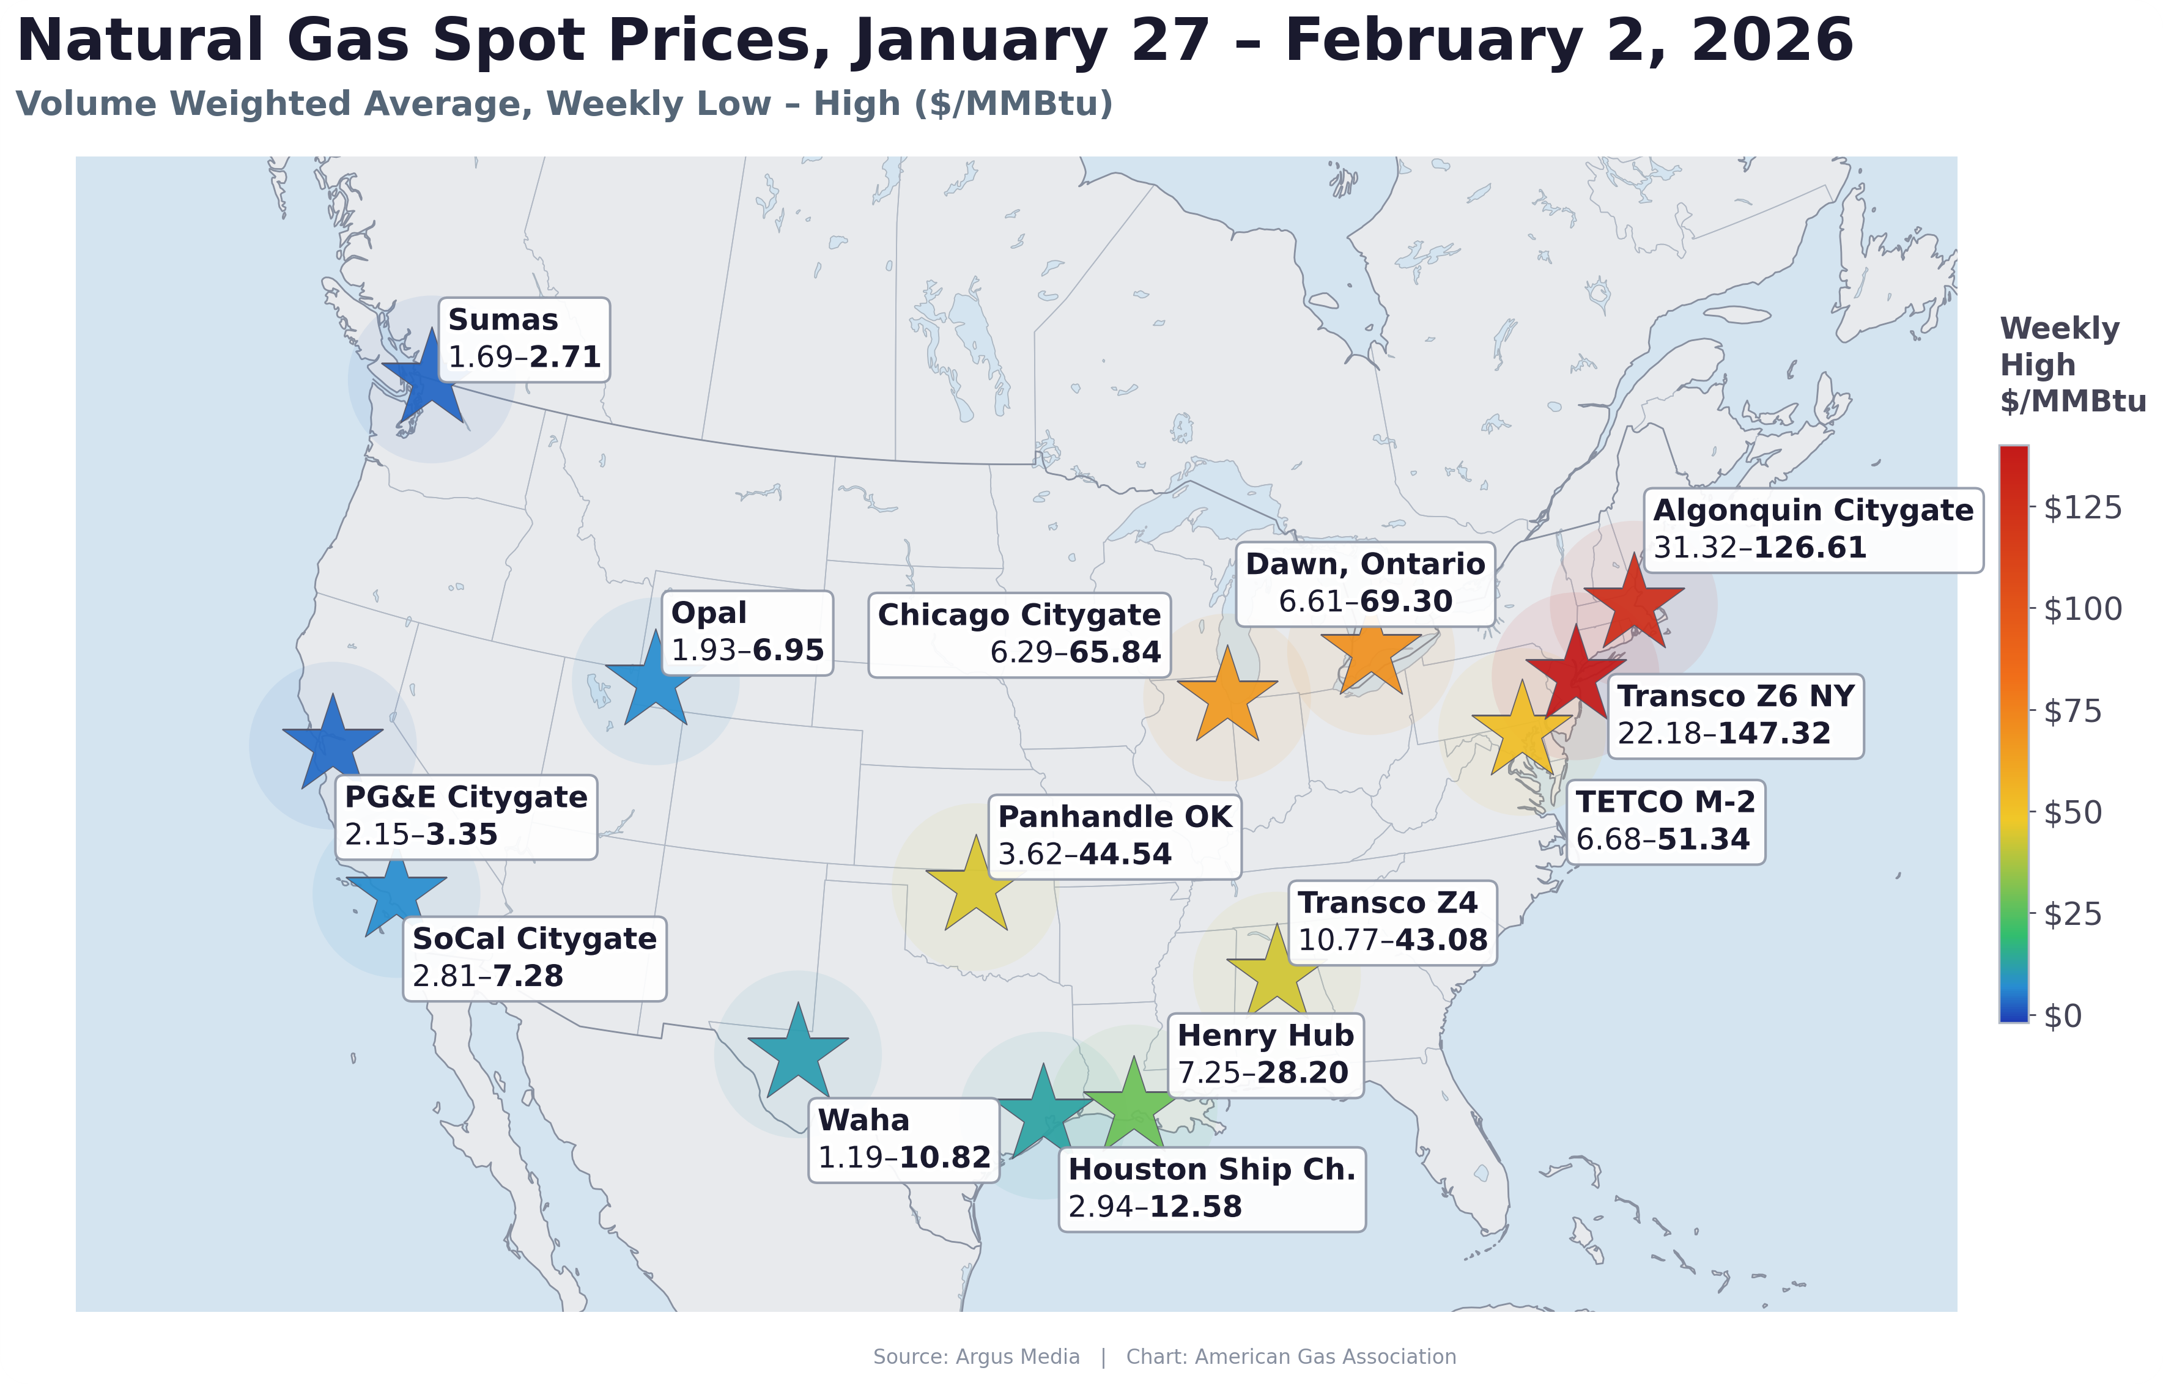
The spot market showed more extreme pricing in the few days surrounding Fern. The Henry Hub spot price surged to an all-time high of $30.72 per MMBtu on January 23, according to EIA data, followed by deflation to $4.40 per MMBtu as of February 2. By comparison, Argus Media data show the Henry Hub spot price reached $28.00 per MMBtu on January 26, the peak of the cold event, before retreating sharply to $12.00 on January 27 and further in subsequent days. Other hubs priced in more extreme premiums, with the Northeast at Iroquois Zone 2 hitting $186.00 per MMBtu on January 26, making it the highest spot price tracked by Argus during that period.
Late-January Arctic Blast Covers Most of the U.S.
An Arctic blast brought brutal cold and catastrophic snow and ice across the U.S. during the penultimate weekend of January. More than 66 million people experienced low temperatures at or under 0°F on Saturday, January 24, and tens of millions saw temperatures at or below -10°F, according to analysis from Weather Trader’s Dr. Ryan Maue. Temperatures continued to dip as the following week opened, pushing up heating demand in many areas following the storm. However, the impacts on electricity systems were acutely felt.
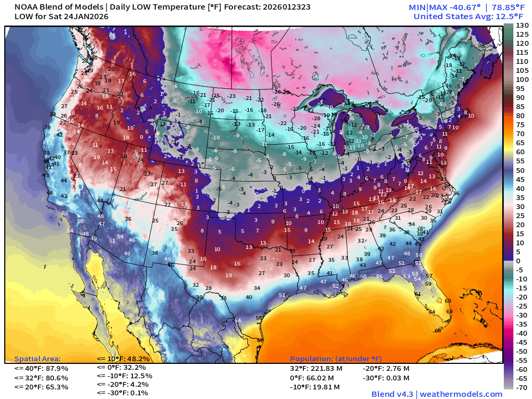
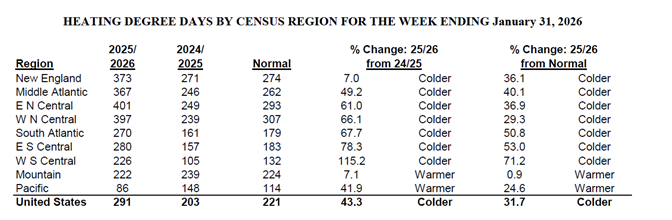
U.S. gas-weighted heating degree days were 32 percent above (colder than) the 30-year normal for the week ending January 31. Regionally, the extremes were more stark. The West South Central region (Texas, Oklahoma, Arkansas, and Louisiana) was 71 percent colder than normal. All central and eastern regions were double-digit percentages colder than the 30-year normal.
Sustained Heating Loads Rewrite the Record Books
Every day from January 24 to January 31, 2026, ranked within the top 20 all-time demand days, according to data from S&P Global Energy, reflecting the depth and duration of the Arctic cold during and directly following Winter Storm Fern. Residential and commercial demand peaked at 72 Bcf per day on January 24, emphasizing the massive amount of energy required to sustain space-heating loads. To put this value into perspective, 70 Bcf of natural gas is equivalent to 900 GW of electricity generation capacity running for 24 hours, the same as 21.6 TWh of electricity. At that scale, the implied power output would far exceed the electricity systems of major advanced economies. In Germany, for example, total installed power generation capacity is around 270 GW, making 900 GW more than three times larger than that country’s entire generation fleet.
On January 26, natural gas demand for electric power generation reached nearly 44 Bcf per day, nearing its prior winter record for gas consumption in the sector, according to data from S&P Global Energy. Natural gas was the number one source of electricity in ERCOT, PJM, NYISO, MISO, the Southeast, and Florida for nine days spanning January 23 through 31, and in Tennessee for eight of those nine days. Gas was similarly critical during many peak hours across these regional grids. In New England, oil was the primary generation source on five of the nine days, and natural gas was number two. In some other regions, natural gas was lower on the dispatch stack after coal, nuclear, and wind, but still within the top three sources of energy during the week.
Industrial natural gas demand climbed to 29 Bcf per day on January 24, among the highest winter-period days.
Production Dips, Then Recovers
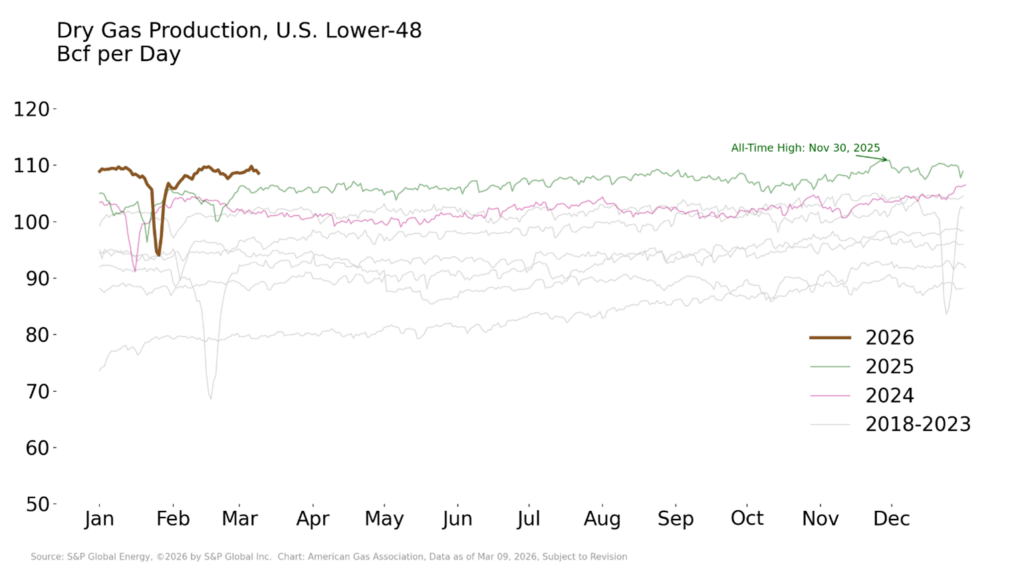
Lower-48 dry gas production declined amid the brutal cold, as moisture at the wellhead or processing facilities froze and impeded the flow of dry gas. Freeze-offs bottomed out at 94 Bcf per day on January 26, roughly 12 percent below pre-event levels of 106.5 Bcf per day (January 13-20 average), according to data from S&P Global Energy. Production rebounded as temperatures eased, and, as of February 4, production levels are back to an output of roughly 105 to 106 Bcf per day.
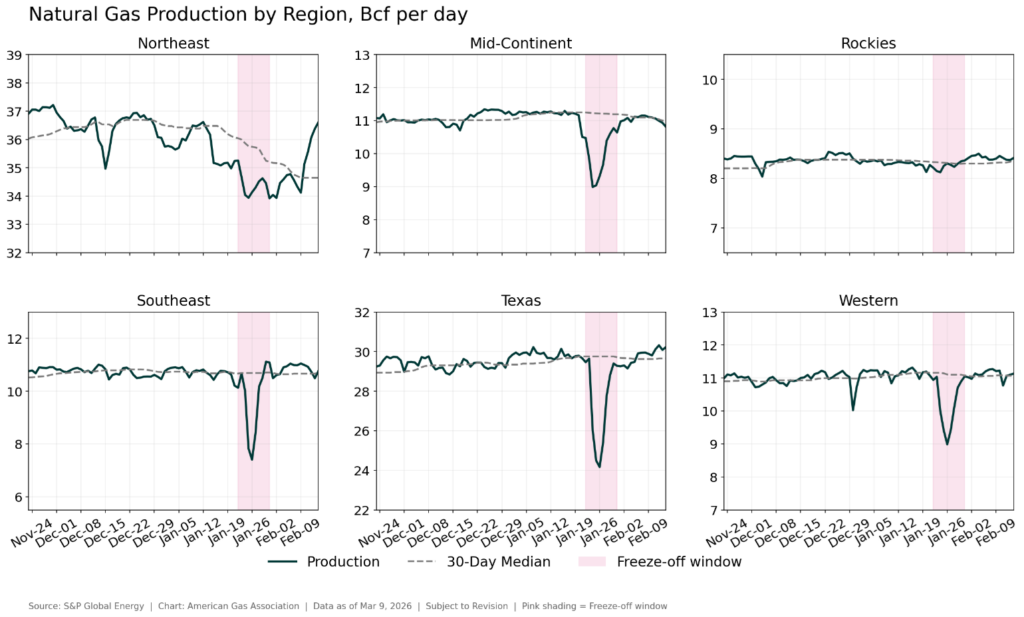
Most of the production declines were concentrated in oil-producing regions, with the largest magnitude decline in Texas (-18 percent), according to data from S&P Global Energy. However, the Southeast, principally the Haynesville basin, saw the largest percentage decline at a 29 percent drop from the pre-event average. By contrast, Northeastern and Rockies production levels were comparatively resilient. Northeast production saw a more modest 3 percent drop from pre-event levels (January 20-23).
LNG Provides Relief to the Domestic Market
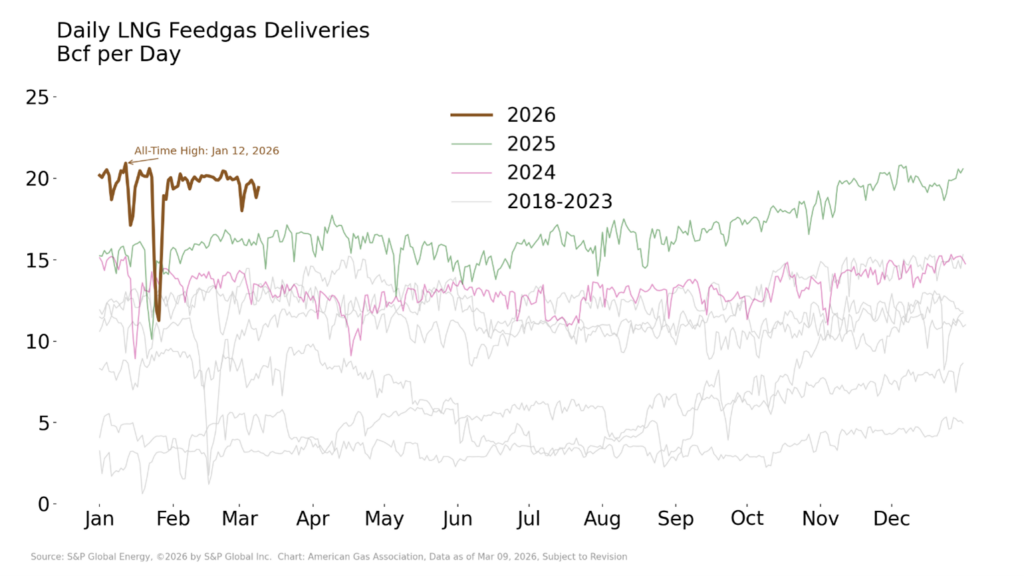
LNG feedgas proved highly flexible, acting as a “relief valve” for the market during the arctic cold as LNG customers reduced demand. LNG export demand (feedgas) declined as much as 44 percent from pre-event levels (January 20-23), then quickly rebounded to 18.9 Bcf per day by January 28, according to data from S&P Global Energy. It’s likely that some LNG consumers on flexible tolling contracts were able to reduce their feedgas demand and possibly redirect gas into the market. Freeport LNG in Texas went partially offline during the freeze, according to Reuters reports. Elba Island in Georgia stopped taking feedgas and switched to imports to provide sendout into the market during the cold event.
In longer-term news, Golden Pass LNG in Texas is expected to begin its first production of LNG in March, according to Exxon Mobil. The $10 billion project would be the next in a series of new export facilities expected to come online over the next few years.
Record Weekly Withdrawals
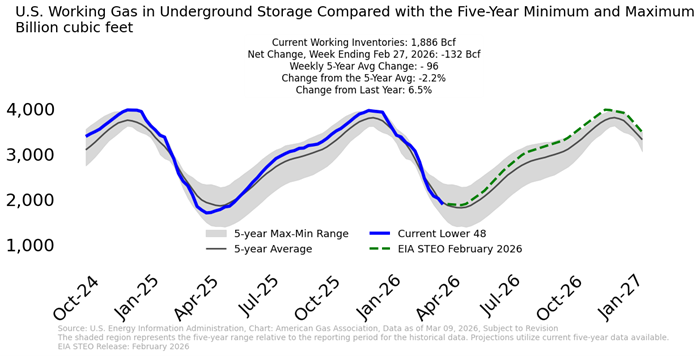
Natural gas underground storage inventories were above the five-year maximum prior to Winter Storm Fern. Record storage withdrawals followed. Inventories dropped 360 Bcf for the week ending January 30, according to the U.S. Energy Information Administration (EIA). This is the largest volume EIA has ever reported withdrawn from storage in a single week, surpassing the previous 2018 record by 1 Bcf. During the winter event, natural gas storage supplied up to 35 percent of total national natural gas demand. Some localities likely used storage more extensively.
Current inventories standing 1.1 percent below the five-year average but remain 1.7 percent above year-ago levels. This suggests still-strong supplies headed into the injection season, and we will see how EIA updates its Short-Term Energy Outlook forecast for February given the substantial record drawdowns in January.
Pipeline Imports Support Heightened Consumption
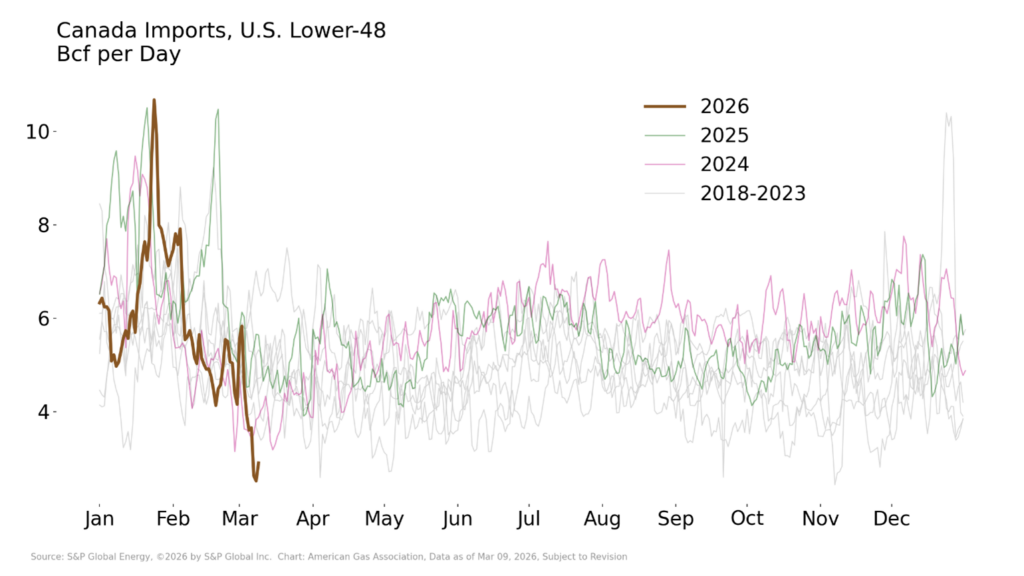
Canadian imports were a key incremental supply source during the winter storm, reaching 10.8 Bcf per day on January 24, according to S&P Global Energy data. This level of daily Canadian imports reached the highest since 2008, underscoring the critical role that Canadian supplies still play in meeting gas demand in the U.S. market during seasonal peaks.
Looking south, daily exports to Mexico dipped as much as 26 percent from the January 20-23 pre-event average, again lending the market a source of flexibility during the cold. Current exports have recovered and are now above 6 Bcf per day, according to S&P Global Energy.
Rig Count Holds Strong
Rig activity did not take a hit during the storm, with the U.S. total adding 2 rigs over the week prior for the week ending January 30, according to data from Baker Hughes. Gas rigs at 125 added three units while oil stayed steady at 411 rigs in operation. There was a decline of one miscellaneous rig. Looking year over year, gas rigs are now up 28 percent while oil is down 14 percent, reflective of the lower oil price environment and possibly the continued increase in activity by gas producers, anticipating growing demand.
What to Watch:
- Prices: After rising steeply during Winter Storm Fern, how might futures pricing evolve as the market reassess storage levels, production resilience, and late-winter weather risk?
- Storage: How quickly can storage inventories stabilize after record withdrawals? The pace of draws and the transition toward injections will shape market confidence heading into shoulder season.
- Demand: With natural gas serving as the backbone of winter electricity supply, policy and planning implications are mounting. What does gas-heavy dispatch during Fern imply for power reliability planning?
Revisions to certain data points and charts made March 12, 2026
For questions please contact Juan Alvarado | jalvarado@aga.org, Liz Pardue | lpardue@aga.org, or Lauren Scott | lscott@aga.org
To be added to the distribution list for this report, please notify Lucy Castaneda-Land | lcastaneda-land@aga.org
Notice
In issuing and making this publication available, AGA is not undertaking to render professional or other services for or on behalf of any person or entity. Nor is AGA undertaking to perform any duty owed by any person or entity to someone else. Anyone using this document should rely on his or her own independent judgment or, as appropriate, seek the advice of a competent professional in determining the exercise of reasonable care in any given circumstances. The statements in this publication are for general information and represent an unaudited compilation of statistical information that could contain coding or processing errors. AGA makes no warranties, express or implied, nor representations about the accuracy of the information in the publication or its appropriateness for any given purpose or situation. This publication shall not be construed as including advice, guidance, or recommendations to take, or not to take, any actions or decisions regarding any matter, including, without limitation, relating to investments or the purchase or sale of any securities, shares or other assets of any kind. Should you take any such action or decision; you do so at your own risk. Information on the topics covered by this publication may be available from other sources, which the user may wish to consult for additional views or information not covered by this publication.
Copyright © 2025 American Gas Association. All rights reserved.