Natural Gas Market Indicators – April 10, 2024
Natural Gas Market Summary
The 2023-2024 winter heating season is coming to a close, setting a remarkable precedent. The January winter storm led to unprecedented daily demand, boosted by heating and power needs. For the winter as a whole, record-warm temperatures weakened demand, helping to depress prices to record levels and resulting in the largest surplus in natural gas storage in nine years by the end of March. However, demand for natural gas in electric power generation reached new highs for the first quarter of the year, driven by winter’s needs, attractive low prices encouraging coal-to-gas switching, and the necessity to balance the expanding renewables sector. While U.S. LNG exports reached new highs, the momentum may have been muted by maintenance at the Freeport LNG facility. Moreover, the long-term future expansion of LNG is uncertain, as the Biden Administration ceased approvals for any new projects past what’s under construction, pending further review.
Reported Prices
April futures have expired and May contracts at Henry Hub are currently trading at $1.83 per MMBtu as of April 4. Day-ahead prices aren’t fairing much differently, with Henry Hub trading at $1.58 per MMBtu for the April 8 delivery date. Looking ahead, the futures strip prices climb steadily through the year. Future delivery contracts are calling for prices above $2.09 per MMBtu beginning in June and reaching as high as $3.754 for the January 2025 contract as of April 4, 2024.
Weather
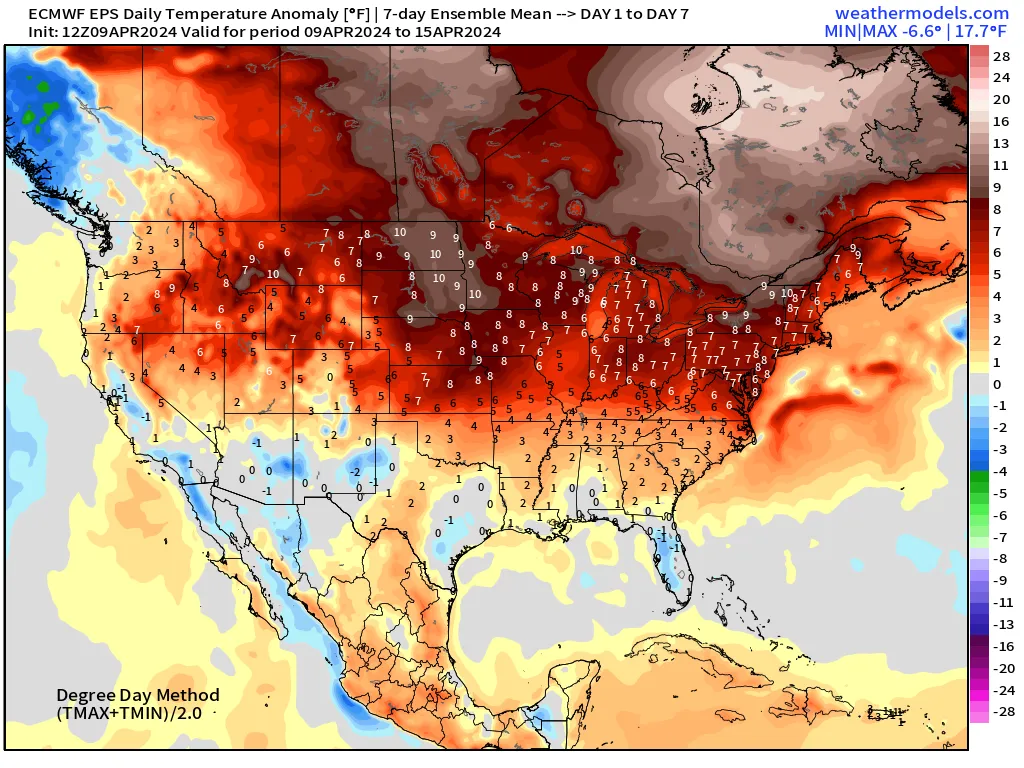
The warm stretch of winter temperatures finally broke at the end of March, with U.S. average heating degree days (HDD) turning colder than normal for the first time in nine weeks. For the week ending March 30, heating-degree days were 8 percent colder than normal, followed by a 2.6 colder-than-normal week ending April 6. The late-season cold extended across the west and into the plains states, plus a ridge of cold in the South Atlantic contributed to heating demand.
April opened with a double-barrel of severe weather across much of the central U.S., followed by a winter storm, including heavy snowfall in the upper midwest and into New England. Forecasts from Weather Trader indicate chilly temperatures across the West Coast and east of the Mississippi through April 7, but then a break with warmer temperatures in the East coming by mid-April.
Used with permission
Demand
The late winter chill boosted natural gas demand as March rolled into April, and overall, demand is starting stronger than last year. At 85.3 Bcf per day, the average month-to-date domestic demand shows a 2.1 Bcf per day (2.5%) incremental gain relative to April 2023, according to data from S&P Global Commodity Insights.
Production
U.S. natural gas production increased by 4% in 2023, maintaining a consistent growth rate with the previous year, according to the Energy Information Administration’s (EIA) latest “Today in Energy” dated March 27. This growth translates to an additional output of 5 Bcf per day, averaging 125 Bcf per day for the year (gross withdrawals). The report highlights that the Appalachia, Permian, and Haynesville regions collectively contributed 59 percent to the total U.S. natural gas production.
Elsewhere at EIA, the Short-Term Energy Outlook notably forecasts now a slight reduction in production for 2024, with an expected average of 103.4 Bcf per day, down from 103.8 Bcf per day in 2023. This projection is attributed to persistently low natural gas prices leading to an anticipated downturn, including operational adjustments by industry players, such as CNX Resources delaying rig completions and EQT reducing its natural gas production by one Bcf per day.
Pipeline Imports and Exports
For April month-to-date, imports from Canada have averaged 5.1 Bcf per day, an increase of 6.3 percent from 2023. Exports to Mexico have similarly gained, up to 5.9 Bcf per day month-to-date, a gain of 11 percent from last year.
LNG Markets
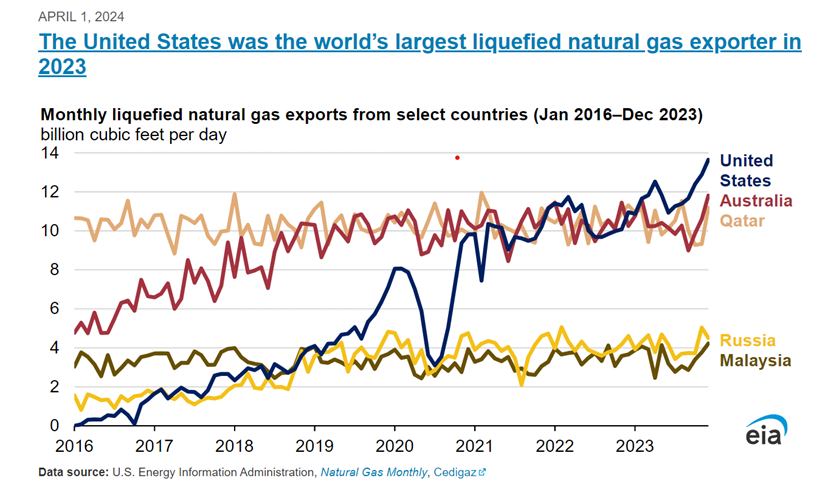
The U.S. exported more LNG in 2023 than any other country, according to the April 1 release of EIA Today in Energy. U.S. LNG exports averaged 11.9 Bcf per day in 2023, a 12 percent increase from the average of 10.9 Bcf per day in 2022. Australia and Qatar were the next largest LNG exporters, maintaining average exports ranging from 10.1 to 10.5 Bcf per day from 2020 to 2023, followed by Russia and Malaysia.
On March 20, Reuters reported that Freeport LNG had shut down the Train 2 liquefaction unit, and Train 1 would be taken offline to undergo inspections and repairs. Freeport anticipates that both units will be repaired and returned online by May. Reuters reports the repairs are the result of the January freeze. A company spokesperson details, “It was during the January freeze that damage occurred in one of the Train 3 motors. Once we understood the cause of the damage, we knew it would be prudent to take proactive steps to inspect our other two trains.” Current feedgas flows are averaging about 12.6 Bcf per day month to date, which is an 8 percent reduction from April 2023.
Working Gas in Underground Storage
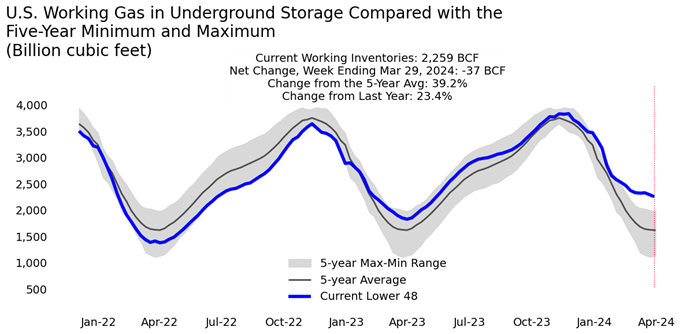
The Energy Information Administration Natural Gas Storage Dashboard reports a 37 Bcf withdrawal from storage for the week ending March 29, placing underground storage stocks at roughly 2,259 Bcf. Underground storage stocks are 23 percent higher year-over-year and 39 percent higher than the five-year average. Warm temperatures and lower winter demand has driven the storage surplus. Underground storage capacity is 53 percent utilized as the winter season comes to an end; the Mount and South Central regions are 62 and 69 percent full, respectively.
Rig Count
Baker Hughes reports 621 rigs for the week ending March 28, a weekly decline of three oil-directed rigs, and no change in the gas count. There are 506 active oil-directed rigs and 112 gas rigs, a 15 and 30 percent decline, respectively.
For questions please contact Juan Alvarado | jalvarado@aga.org or Morgan Hoy | mhoy@aga.org
To be added to the distribution list for this report, please notify Lucy Castaneda-Land | lcastaneda-land@aga.org
NOTICE
In issuing and making this publication available, AGA is not undertaking to render professional or other services for or on behalf of any person or entity. Nor is AGA undertaking to perform any duty owed by any person or entity to someone else. Anyone using this document should rely on his or her own independent judgment or, as appropriate, seek the advice of a competent professional in determining the exercise of reasonable care in any given circumstances. The statements in this publication are for general information and represent an unaudited compilation of statistical information that could contain coding or processing errors. AGA makes no warranties, express or implied, nor representations about the accuracy of the information in the publication or its appropriateness for any given purpose or situation. This publication shall not be construed as including, advice, guidance, or recommendations to take, or not to take, any actions or decisions regarding any matter, including without limitation relating to investments or the purchase or sale of any securities, shares or other assets of any kind. Should you take any such action or decision; you do so at your own risk. Information on the topics covered by this publication may be available from other sources, which the user may wish to consult for additional views or information not covered by this publication.
Copyright © 2024 American Gas Association. All rights reserved.