Natural Gas Market Indicators – April 2, 2026
Natural Gas Market Summary
U.S. natural gas prices exited the 2025-2026 winter heating season on stable footing, as mild late-season temperatures and strong production pulled Henry Hub prompt-month prices below $3 per MMBtu entering the May contract, amid easing residential and commercial demand and underground storage in surplus territory. While a January cold snap briefly tightened balances, warmer-than-normal March conditions limited end-of-season withdrawals, reinforcing a near-term outlook of modest prices as the market shifts into the shoulder season.
Looking ahead, fundamentals suggest continued near-term stability despite ongoing geopolitical uncertainty. Production is in record territory year to date, supported by associated gas growth and improved drilling efficiency, while record LNG feedgas volumes continue to anchor demand, and the conflict in the Middle East tightens LNG supply in global energy markets. In the near term, spring prices are expected to remain relatively muted. However, upside risk could emerge this summer if export growth, power demand, and weather variability tighten market balances.
Henry Hub Prompt Month at Six-Month Low
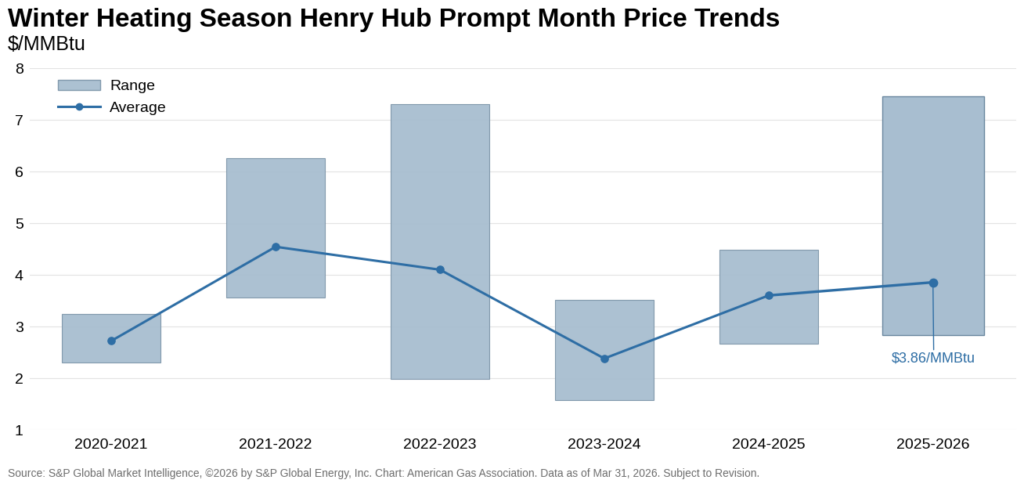
After a volatile winter, Henry Hub prompt-month futures fell to a six-month low of $2.82 per MMBtu on April 2, down 4.5 percent week-over-week. Natural gas prices softened at the end of the first quarter, with the prompt month stepping down notably between the April and May contracts. The April prompt-month contract settled at $3.10 per MMBtu at expiration on March 27, while the May contract opened at $2.89 per MMBtu on March 30—a decline of more than 20 cents in a single trading day as the market moved past elevated winter demand.
Throughout March, the Henry Hub prompt month struggled to hold above $3 per MMBtu, averaging $3.04 and finishing 2.6 percent lower than the first trading day of the month. Futures remained relatively soft overall, reflecting easing winter demand and stable inventory levels as the market transitions into the spring shoulder season. For the 2025-2026 winter heating season, prompt-month prices averaged $3.86 per MMBtu.
2025-2026 Winter Was 6.5 Percent Colder than Normal
The 2025-2026 winter heating season has officially come to a close, ranking as the second-warmest winter in the lower 48 since the 2019-2020 season. Gas utility-weighted heating degree days (HDDs) totaled 3,636, making the season more than 6.5 percent warmer than the 30-year normal and 2.9 percent warmer than last winter. January was the only month colder than normal in the lower 48, with total HDDs rising 2.5 percent above the monthly normal.
For the week ending March 31, weather across the lower 48 was 28.2 percent warmer than normal and 10.6 percent warmer than the same week last year. All regions were warmer than normal, with deviations ranging from 1.9 warmer in New England to 79.5 percent warmer in the West South Central. Through mid-April, the National Oceanic and Atmospheric Administration’s 8-to-14-day outlook anticipates above normal temperatures across most of the U.S., with below- to near-normal temperatures limited to small portions of Alaska, Maine, Minnesota, and North Dakota.
Heating Demand Dampens on Mild March Weather
In March, total U.S. natural gas demand, including exports, declined by 15.2 percent from last month but increased by 2.8 percent over the same period last year, according to preliminary data from S&P Global Energy. Year-over-year demand growth continues to be driven by strong export demand and electric power consumption, which increased by 13.8 percent and 12.3 percent, respectively, in March. In contrast, warmer-than-normal temperatures reduced space-heating demand, causing residential and commercial consumption to fall 39 percent from last month and 14 percent relative to March 2025.
First Quarter Production Higher Despite Lower Rig Count
Dry natural gas production climbed in March, edging 0.4 percent higher than February levels and nearly 3 percent higher than the same month last year, according to preliminary data from S&P Global Energy. For the year to date through April 2, production is up 3.6 percent, reflecting strong output despite temporary disruptions associated with Winter Storm Fern. Growth has been supported by efficiency gains, helping sustain near-record monthly production levels even as drilling activity moderates.
LNG Feedgas at New Record, Golden Pass Begins Production
U.S. LNG feedgas flows reached a record high of 19.7 Bcf per day on March 28, surpassing the previous all-time high set on January 12, 2026, by 0.4 percent, according to preliminary data from Rystad Energy. The record coincides with the first production of LNG from Train 1 at Golden Pass LNG’s Sabine Pass terminal on March 30, after ramping feedgas deliveries to the liquefaction plant to roughly 0.3 Bcf per day in mid-March. For the year to date through March 31, feedgas deliveries are more than 20 percent higher than year-ago levels.
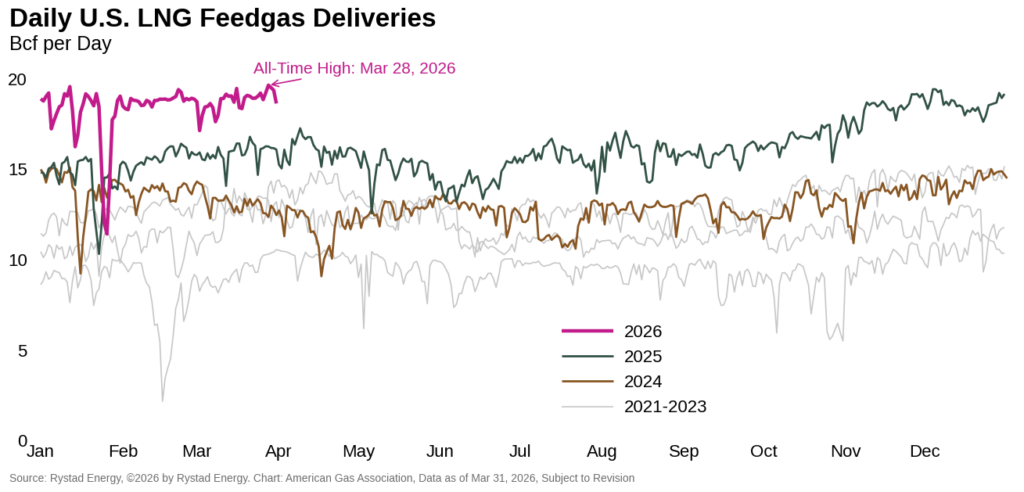
The new high also reflects strengthening global demand for U.S. LNG as geopolitical tensions in the Middle East persist and the spread between Henry Hub futures and Europe’s benchmark natural gas price, the Dutch Title Transfer Facility, widens. According to Rystad Energy, the widening spread is supporting the economics of domestic LNG exports, as European and Asian buyers rely more heavily on U.S. cargoes to help offset supply risks and disruptions linked to the Middle East.
Further tightening global supply, a tropical cyclone swept through Western Australia’s key offshore gas corridor on March 26, forcing the shut-in of 29 million tons per annum (mtpa) of LNG production capacity. The four affected facilities accounted for around 8 percent of global LNG trade in February. Combined with the ongoing shut-in in Qatar, nearly a quarter of global supply was offline at the peak of the disruption. At the time of writing, most facilities appear to have resumed normal operations, but that Wheatstone LNG is expected to remain offline for several weeks, reducing production capacity by 8.9 mtpa.
Late-Season Injection Lifts Storage at Winter’s End
Natural gas storage inventories increased in the final week of the 2025-2026 winter heating season, marking a late-season injection as the shoulder months begin. The Energy Information Administration reported a net injection of 36 Bcf into underground storage for the week ending March 27, partially offsetting the prior week’s net withdrawal.
Total inventories now stand at 1,865 Bcf, 3 percent above the five-year average and 5.4 percent higher than year-ago levels. The week-over-week gain was driven by a 34 Bcf net injection in the South Central region, where inventories remain 2.6 percent below their five-year average. Despite the build, regional inventories remain uneven. The East and Midwest regions are 13.5 percent and 13.4 percent, respectively, below their five-year averages, while the Mountain region holds the largest surplus of more than 70 percent.
In late March, Caliche Development Partners received approval from the Federal Energy Regulatory Commission to expand the Golden Triangle natural gas storage facility in Texas. The expansion would double the number of salt dome storage caverns at the facility and increase storage capacity by 30 Bcf. When finished, injection and withdrawal capacities are expected to increase to 2.2 Bcf per day and 2.5 Bcf per day, respectively. According to Caliche, the expansion will allow Golden Triangle Storage to become the Gulf Coast’s largest storage hub by volume and injectability.
Imports from Canada Decline
Reflecting milder March temperatures, net cross-border pipeline trade with Canada declined from the previous month. According to preliminary data from Rystad Energy, net imports from Canada averaged 3.6 Bcf per day for the month-to-date through March 30, down approximately 22 percent from the same period in 2025. By comparison, net trade with Mexico remained flat over the two periods, averaging 5.9 Bcf per day in March 2025 and 2026.
Weekly Rig Counts Decline in Late March
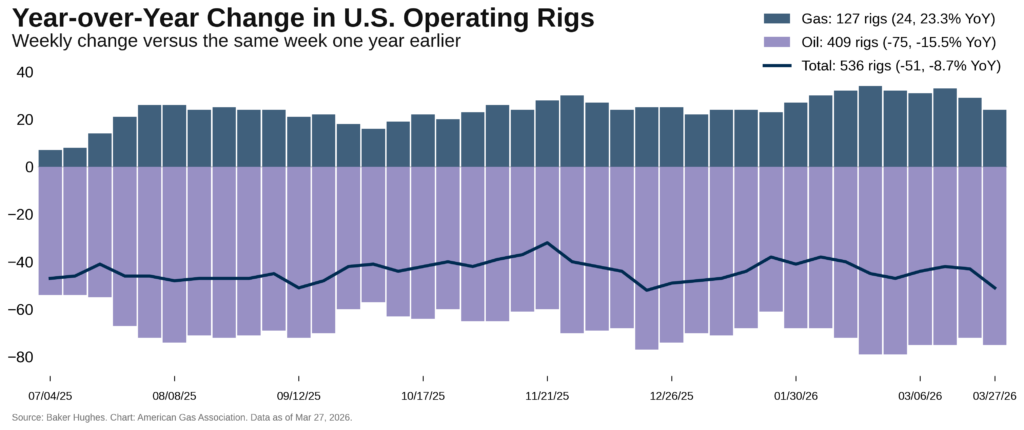
Rig count data from Baker Hughes show that the total U.S. rig count declined by nine to 543 for the week ending March 27, a change of 1.6 percent. Gas-directed rigs decreased by four to 127, while oil rigs increased by five to 409.
While gas rigs declined modestly week-over-week, the number in operation remains significantly higher than year-ago levels. Compared with the same week last year, gas rigs are up by 24 rigs, a year-over-year increase of more than 23 percent. In contrast, oil-directed activity remains 15.5 percent below year-ago levels. Including miscellaneous rigs, the total U.S. rig count is down 49 rigs year-over-year, 8.3 percent lower than year-ago levels.
What to Watch:
- LNG: With a new daily feedgas record, Golden Pass commissioning, and the global LNG market tightening, will storage injections compete with rising export demand as the shoulder season begins?
- Prices: Despite futures prices below $3 and strong supply fundamentals, the 12-month strip indicates bullish pricing sentiment. Will the U.S. face a tighter natural gas market in the coming year?
- Rigs and Production: With dry natural gas production holding firm despite lower rig counts in March, are operators relying on DUC drawdowns or productivity gains, and how sustainable are those trends through the summer?
For questions please contact Juan Alvarado | jalvarado@aga.org, Liz Pardue | lpardue@aga.org, or Lauren Scott | lscott@aga.org
To be added to the distribution list for this report, please notify Lucy Castaneda-Land | lcastaneda-land@aga.org
Notice
In issuing and making this publication available, AGA is not undertaking to render professional or other services for or on behalf of any person or entity. Nor is AGA undertaking to perform any duty owed by any person or entity to someone else. Anyone using this document should rely on his or her own independent judgment or, as appropriate, seek the advice of a competent professional in determining the exercise of reasonable care in any given circumstances. The statements in this publication are for general information and represent an unaudited compilation of statistical information that could contain coding or processing errors. AGA makes no warranties, express or implied, nor representations about the accuracy of the information in the publication or its appropriateness for any given purpose or situation. This publication shall not be construed as including advice, guidance, or recommendations to take, or not to take, any actions or decisions regarding any matter, including, without limitation, relating to investments or the purchase or sale of any securities, shares or other assets of any kind. Should you take any such action or decision; you do so at your own risk. Information on the topics covered by this publication may be available from other sources, which the user may wish to consult for additional views or information not covered by this publication.
Copyright © 2025 American Gas Association. All rights reserved.