Natural Gas Market Indicators – August 14, 2025
Natural Gas Market Summary
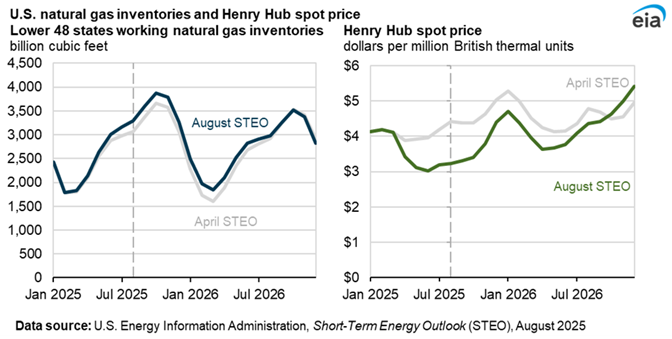
The natural gas market continues to boom. Despite a short-term dip in domestic demand, monthly production continues at record levels and, year-to-date, LNG feedgas flows are averaging 2.5 Bcf per day higher than in 2024, according to data from Rystad Energy. The EIA’s August Short-Term Energy Outlook (STEO) attributes higher-than-anticipated underground storage inventories and softening futures prices to increased rig activity in gas-intensive shale plays, reinforcing strong production trends in 2025.
The August STEO anticipates these conditions could persist in the near term, even as falling oil prices curb associated gas output. In 2025, production is projected to rise by 3.8 Bcf per day over 2024 volumes to meet growing demand from new LNG projects coming online in 2025 and 2026, including Golden Pass and Plaquemines LNG Phase 2. Supporting this outlook, Cheniere recently announced a 21-year agreement to supply one million metric tons of LNG annually to Japan’s largest power generation company starting in 2029.
The EIA also revised its price outlook in the August STEO, now forecasting Henry Hub spot prices to average $3.60 per MMBtu in 2025 and $4.30 per MMBtu in 2026, 21 percent and 6 percent lower, respectively, than the April forecast. Robust storage inventories are a key factor in this downward revision.
Futures Dip Below $3 per MMBtu
Henry Hub September futures contracts settled at $2.83 per MMBtu on August 13, the lowest prompt month settlement since November 2024, according to CME data. Prompt month prices have declined 31.6 percent from an injection season high of $4.14 per MMBtu on April 3. Similarly, the 12-month strip has softened, holding between $3.50 and $3.80 per MMBtu since July 23, the lowest range since early January 2025.
Argus reports the following regional natural gas spot prices as of August 13:
- In the Northeast, prices reached $2.91 per MMBtu, the highest regional price of the day.
- The Southwest had the lowest regional price of $1.99 per MMBtu.
- Outside these values, regional spot prices ranged from $2.31 per MMBtu in the Rockies and Northwest to $2.90 per MMBtu in Louisiana and the Southeast.
- Prices in Western Canada were $0.58 per MMBtu.
Lower 48 Expects Mixed Temperature Trends into Late August
For the week ending August 9, temperatures in the U.S. were 23.9 percent cooler than last year and 6.9 percent warmer than the 30-year normal, according to population weighted cooling degree days (CDDs). All regions were cooler than last year except the East North Central, West South Central, Mountain, and Pacific regions.
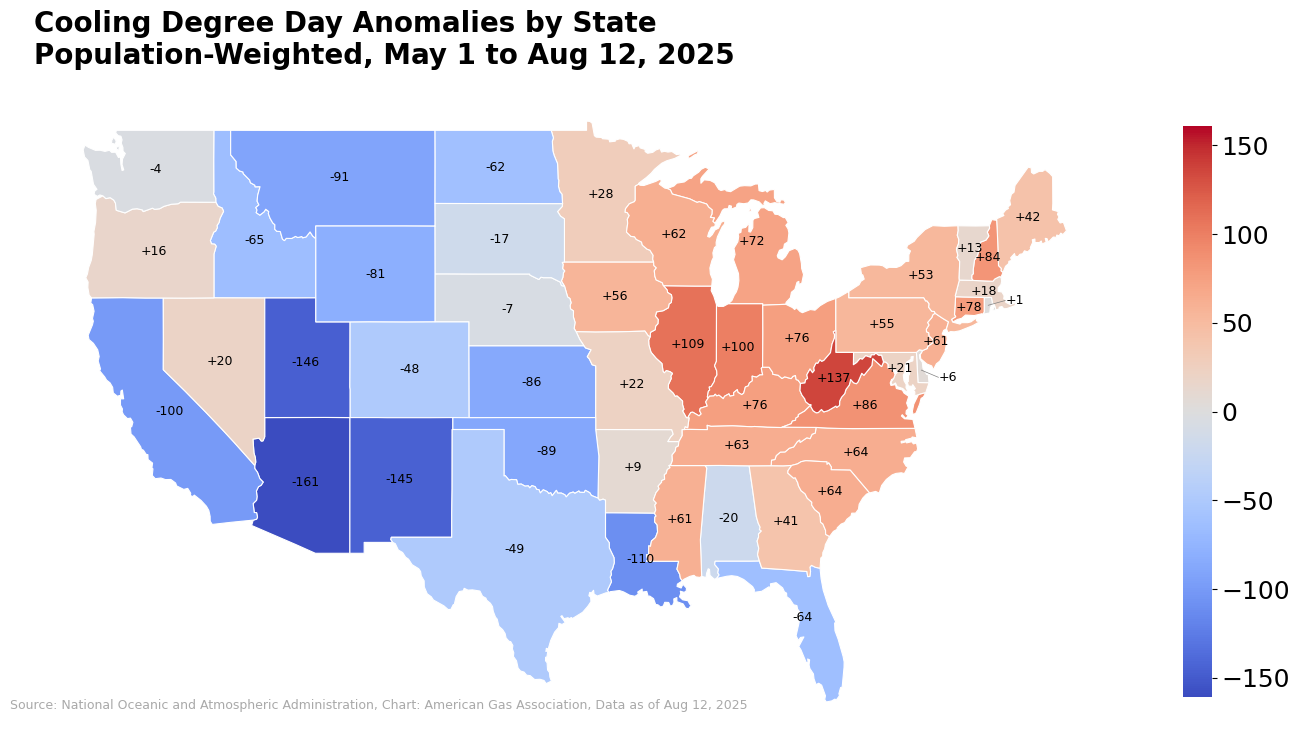
Data from the National Oceanic and Atmospheric Administration (NOAA) reports that cumulative cooling degree days for the lower 48 from May 1 through August 12 totaled 839, four CDDs above the 30-year average. Cumulative CDDs are trending above normal across the East Coast but below normal across much of the West Coast. Over this period, West Virginia had the largest positive deviation from normal (+137 CDDs) and Arizona had the largest negative deviation (-161 CDDs).
The NOAA Climate Prediction Center’s 8-14 day outlook anticipates above-normal temperatures across much of the West, southern Plains, and Florida in late August, with the highest probabilities reaching 70 to 80 percent in the interior Northwest. Cooler-than-normal conditions are expected in the northern Great Lakes, Upper Midwest, and parts of the Northeast, while near-normal temperatures are forecast for portions of the central and mid-Atlantic states. The National Hurricane Center is tracking Tropical Storm Erin, expected to become a hurricane as it approaches the Virgin Islands and Puerto Rico into the weekend.
Residential and Commercial Demand Climbs Year-Over-Year
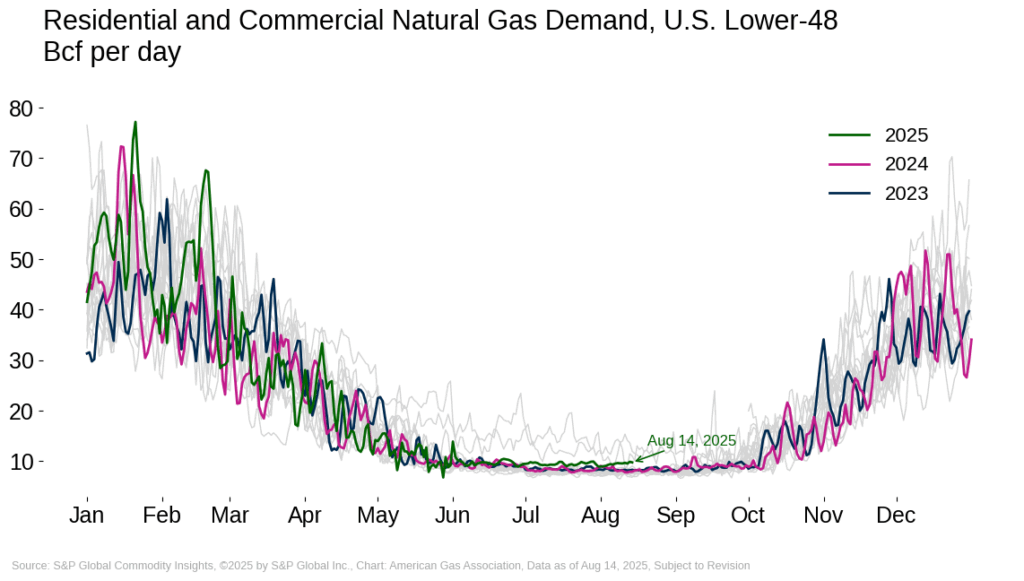
For the week ending August 14, average daily domestic natural gas consumption increased 6.8 percent compared to last week, according to preliminary data from S&P Global Commodity Insights (S&P Global). Over this period, industrial demand fell 1.2 percent, while power sector demand climbed 11.6 percent. Residential and commercial consumption increased 4.7 percent.
Year-over-year, domestic consumption is up 1.2 percent. Electric power consumption and industrial demand are down compared to last year, falling 0.8 percent and 1.9 percent, respectively. However, these losses are offset by a 21 percent increase in residential and commercial demand. Climbing residential and commercial demand may be related to softening gas prices in August and continued customer growth. Between August 1 and August 14, average daily demand is up 13.8 percent over 2024 levels. Year-to-date residential and commercial consumption is also higher than during the same period last year, rising 11 percent.
Strong Production Continues
Monthly natural gas production remains at record highs. For the month of August to date, preliminary data from S&P Global reports that average daily production is at an all-time high, rising 0.2 percent above the previous high set in July 2025.
For the week ending August 14:
- Production levels are flat compared to last week but up 4.7 percent relative to last year.
- Every region except the Rockies posted year-over-year production gains within a range of 3.2 percent in Texas to 9.6 percent in the Western region.
- The Midcontinent, Rockies, and Southeast posted weekly declines, falling by 0.2 percent, 1.2 percent, and 2.1 percent, respectively.
Sustained LNG Demand
Between July 31 and August 7, 30 LNG vessels with a combined carrying capacity of 113 Bcf departed from the U.S., according to Bloomberg Finance, L.P. shipping data reported by the EIA. Compared to the previous week, the number of vessels and combined carrying capacity increased by two ships and 5 Bcf, respectively. For the week ending August 13, Rystad Energy reports that feedgas flows to LNG terminals reached 16.5 Bcf per day, increasing 0.5 Bcf per day over last week and 3.6 Bcf per day year-over-year. For the year to date, feedgas flows have averaged 15.4 Bcf per day, up 19.6 percent over last year’s levels.
Imports to Canada Fall Year-Over-Year in Mid-August
Preliminary data from S&P Global indicate that natural gas imports from Canada increased by 8.2 percent week-over-week and declined by 9.7 percent year-over-year for the week ending August 14. Year-over-year declines may be related to strong domestic production trends in 2025 and higher commodity prices relative to the record lows experienced in 2024. The EIA reports that lower prices in 2024 contributed to a 7 percent increase in the volume of natural gas imported from Canada compared to the year prior. In contrast, exports to Mexico remain steady. For the week ending August 14, exports rose 0.5 percent over last week and fell 0.6 percent compared to last year.
Natural Gas Rig Activity Supports Production Trends
For the week ending August 8, the number of active rigs in the U.S. totaled 539, a decrease of one rig from last week and a decline of 49 rigs compared to the same week last year, according to Baker Hughes. Oil rig counts have declined by 74 year-over-year, while gas rigs have risen by 26, bringing total gas rigs to 123 compared to 97 in 2024. The annual increase in gas rigs underscores trends of sustained natural gas demand in 2025 and supports record production levels. On a week-to-week basis, the gas rig count declined by one, driven by reductions in the Eagle Ford and Permian Basins.
Storage Injections Remain Steady
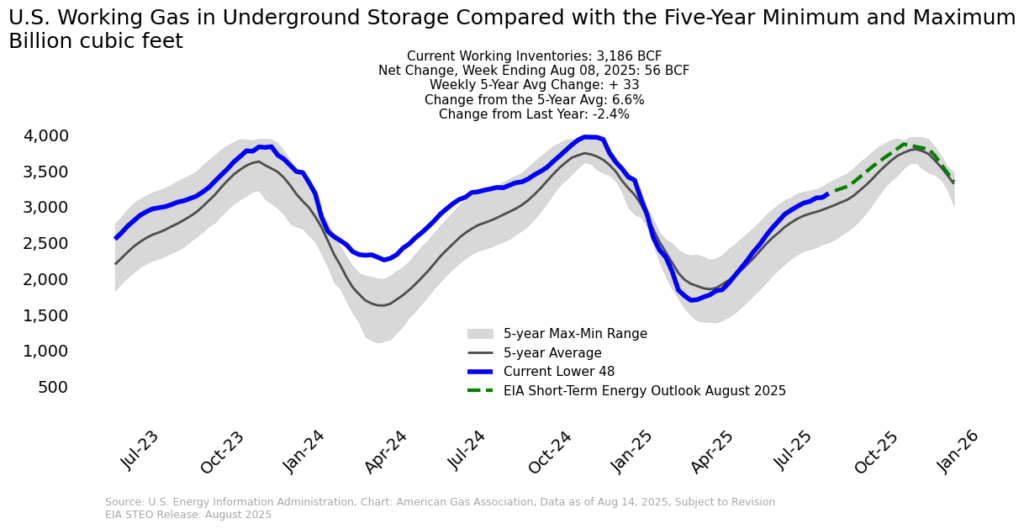
Total working gas stocks in the lower 48 reached 3,186 Bcf for the week ending August 8, following a net injection of 56 Bcf, according to the EIA’s latest storage report. For the week, inventories levels were 196 Bcf, or 6.6 percent, above the five-year average, but remain 2.4 percent below year-ago levels. All regions except the Pacific posted net injections, with the East recording the largest weekly increase at 3.2 percent. The Mountain region holds the largest surplus relative to its five-year average at 26.5 percent, and, as of August 1, has the highest capacity utilization in the lower 48 at 94 percent.
What to Watch:
- Rig Count: How could softening futures prices impact annual gains in gas-rig count?
- Demand: Will mixed regional temperatures, with above-normal probabilities along parts of the East Coast and cooler conditions in the northern tier, constrain total cooling demand through late August?
- Storage: Could persistent above-average inventories support softening price trends through the fall?
For questions please contact Juan Alvarado | jalvarado@aga.org, Liz Pardue | lpardue@aga.org, or
Lauren Scott | lscott@aga.org
To be added to the distribution list for this report, please notify Lucy Castaneda-Land | lcastaneda-land@aga.org
NOTICE
In issuing and making this publication available, AGA is not undertaking to render professional or other services for or on behalf of any person or entity. Nor is AGA undertaking to perform any duty owed by any person or entity to someone else. Anyone using this document should rely on his or her own independent judgment or, as appropriate, seek the advice of a competent professional in determining the exercise of reasonable care in any given circumstances. The statements in this publication are for general information and represent an unaudited compilation of statistical information that could contain coding or processing errors. AGA makes no warranties, express or implied, nor representations about the accuracy of the information in the publication or its appropriateness for any given purpose or situation. This publication shall not be construed as including advice, guidance, or recommendations to take, or not to take, any actions or decisions regarding any matter, including, without limitation, relating to investments or the purchase or sale of any securities, shares or other assets of any kind. Should you take any such action or decision; you do so at your own risk. Information on the topics covered by this publication may be available from other sources, which the user may wish to consult for additional views or information not covered by this publication.
Copyright © 2025 American Gas Association. All rights reserved.Natural Gas Market Indicators – June 6, 2025