Natural Gas Market Indicators – August 28, 2025
Natural Gas Market Summary
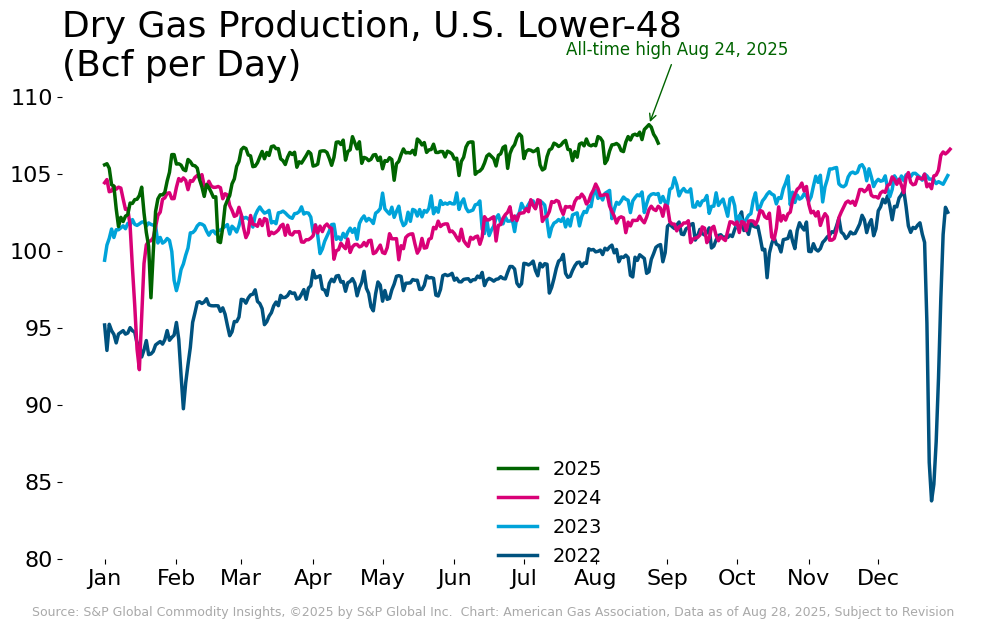
U.S. natural gas production has reached new highs in August amid relatively low prices and rising demand expectations for exports and domestic end uses such as data centers, prompting questions about how the North American natural gas market will respond. Daily dry gas flows set records on three consecutive days between August 22 and 24, surpassing 108 Bcf per day, according to preliminary data from S&P Global Commodity Insights (S&P Global). Gas drilling rig activity is up 26 percent from last year, underscoring supply strength, yet prices remain subdued. The Henry Hub prompt month fell to $2.70 on August 22, its lowest daily settlement since early November 2024.
On the demand side, the picture is mixed for the month to date. Overall, demand is at record levels, but natural gas consumption in the electric power sector is tracking the lowest August since 2021 due to milder weather, which has, in turn, contributed to a larger storage rebuild. By contrast, natural gas exports are strong. For the month to date through August 24, LNG feedgas volumes are up 25 percent from last year and are on track to set a new annual record, while pipeline exports to Mexico reached a new daily high this month. The result is a natural gas market that continues to meet demand growth at relatively low prices while building inventories in preparation for the winter heating season.
Henry Hub September Contract Closes 6 Percent Lower
The September Henry Hub contract expired at $2.87 per MMBtu on August 27, down nearly 6 percent since its rollover as the prompt month on July 30. Week-over-week, the prompt month is up 4.2 percent. Midday on August 28, the new October prompt month contract traded 3 percent higher than its open price of $2.87 per MMBtu. The 12-month strip settled at $3.54 per MMBtu on August 27, 1.2 percent higher week-over-week. At settlement on August 27, the spread between the 12-month strip and prompt month was 67 cents.
Argus reports the following regional natural gas spot prices as of August 27:
- Louisiana and the Southeast posted the highest regional price of the day at $2.70 per MMBtu.
- Appalachia had the lowest regional price of $1.42 per MMBtu.
- Other regional prices ranged from $1.78 per MMBtu in the Northeast to $2.55 per MMBtu in East Texas.
Early September Forecasts East Coast Cooling, Western Heat, and Storm Activity
Temperatures in the U.S. were 14.8 percent warmer than last year and 9.4 percent warmer than the 30-year normal for the week ending August 23, based on population-weighted CDDs reported by the National Oceanic and Atmospheric Administration (NOAA). All regions recorded warmer conditions for the week relative to last year, except the Middle Atlantic and West South Central, which were 6.5 and 11.6 percent cooler from the same week in 2024.
Between August 1 and 26, cumulative CDDs for the lower 48 were 6.2 percent lower (colder) than normal, which has contributed to lower demand for gas for electric power. Cooler-than-normal temperatures were concentrated along the East Coast, with negative deviations ranging from 1 percent in Alabama to 31 percent in Montana.
As September begins, the NOAA Climate Prediction Center’s 8-14 day outlook anticipates below normal temperatures across much of the central and eastern U.S., while above normal temperatures are expected in the West, Gulf Coast, Florida, and Alaska. Near normal conditions are expected in parts of the northern Rockies and Northeast.
Along the coasts, the National Hurricane Center (NHC) is tracking three cyclone disturbances in the Pacific, has issued its final advisories for Post-Tropical Cyclone Fernand in the Atlantic and Post-Tropical Cyclone Juliette in the Pacific. In an August 7 update to its 2025 Atlantic Hurricane Season Outlook, the agency revised the probability of an above-normal season from 60 percent to 50 percent. Between two and five major hurricanes are still expected for the season.
Electric Power Demand Down Month-To-Date Compared to 2024
For the week ending August 28, total demand, including exports, was down 3.5 percent week-over-week and lagged prior year levels by 2.7 percent, according to preliminary data from S&P Global. Domestic consumption is down 5.8 percent week-over-week, driven by lower demand for electric power generation. Residential and commercial sector demand is up 2.8 percent week-over-week, and the industrial sector gained 1.3 percent over the same period. Year-over-year, domestic consumption is down 8.5 percent.
Rystad Energy data indicates that demand for natural gas in the electric power sector averaged 46.8 Bcf per day for the week ending August 26, down 6.5 percent from the prior week but up nearly 6 percent year-over-year. For the month to date, current demand is 1.7 percent lower than the same period last year.
Signals of future domestic demand growth are taking shape. Earlier this week, MISO reported receiving nearly 50 applications totaling 26.6 GW for its Expedited Resource Addition Study (ERAS) to meet increasing load demand. Of those applications, 19.7 GW or approximately 75 percent were for gas-fueled projects. Proposals submitted under the ERAS project will be evaluated through the end of the program in August 2027.
Production Reaches New Heights
Daily dry natural gas production is breaking records in late August. On August 20, output edged past the previous high from June 29, 2025, by 0.1 percent, marking the first of several records within a week, according to preliminary data from S&P Global. New highs followed on August 22, 23, and 24, with the August 24 peak surpassing 108 Bcf per day. For perspective, today’s record is nearly 45 percent higher than the then-daily peak of approximately 75 Bcf per day a decade ago.
For the week ending August 28:
- Production levels rose 4.9 percent relative to last year and increased 0.3 percent compared to last week.
- All regions except Texas and the Mid Continent recorded weekly gains, ranging from 0.3 percent in the Northeast to 1.8 percent in the Southeast.
- Year-over-year, every region posted higher volumes, led by the Western region with an 11.6 percent increase compared to last year.
LNG Feedgas Remains in Record Territory
For the week of August 14 to August 20, 31 LNG vessels with a combined carrying capacity of 116 Bcf departed the U.S., according to Bloomberg Finance, L.P. shipping data reported by the EIA. Eight departed from Sabine Pass, six from Plaquemines, and five from Corpus Christi, with the remaining vessels departing from Freeport, Cameron, Cove Point, Calcasieu Pass, and Elba Island facilities. Compared to the week prior, one additional ship departed the U.S., adding 6 Bcf of carrying capacity.
Rystad Energy reports LNG feedgas deliveries averaged 16.1 Bcf per day for the week ending August 27, up 6.2 percent week-over-week. Compared to the same week last year, LNG feedgas deliveries are nearly 24 percent higher.
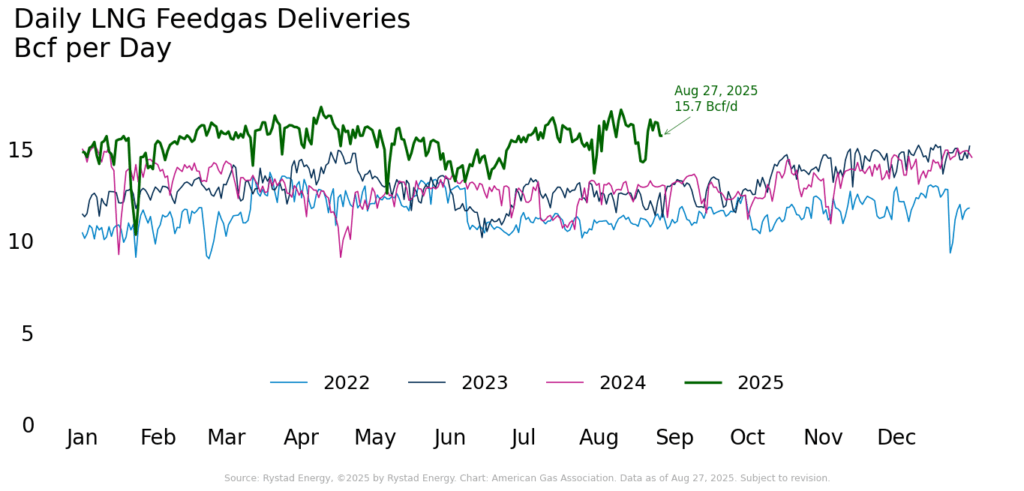
According to Reuters, global energy demand for natural gas is rising as more countries switch from coal- to gas-powered generation, contributing to rising domestic production volumes and expectations that U.S. LNG exports could increase by approximately 10 percent annually through 2030. Through July, shipments averaged 13.1 Bcf per day, more than 12 percent higher than the same period in 2024, according to data from Rystad Energy.
This week, Sempra and EQT announced a 20-year agreement in which Sempra’s Port Arthur Phase 2 LNG project would supply 2 million tons per annum (Mtpa) to EQT. Sempra entered a similar agreement for 4 Mtpa with ConocoPhillips last week. The company plans to reach final investment decision later this year. Sempra’s Port Arthur Phase 1 facility is currently under construction and expected to begin operations in 2027.
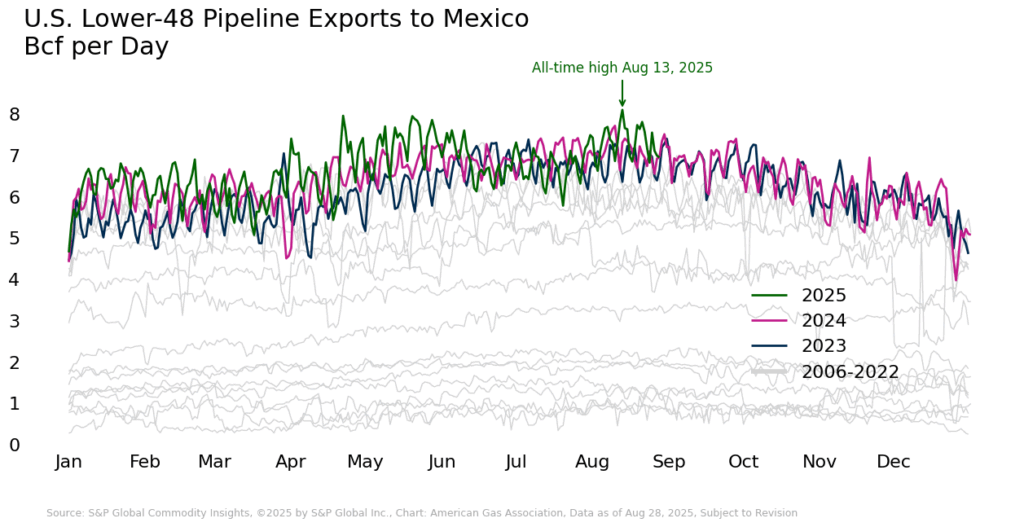
U.S. Exports to Mexico Set New Record
Preliminary data from S&P Global indicate that natural gas exports to Mexico reached a new daily record on August 13, increasing 1.8 percent over the previous high set in April 2025. This trend reflects growing demand for U.S. natural gas exports to Mexico in 2025. Except for July, every month for the year to date has broken its previous record high. From January 1 to August 28, year-to-date exports are on track to break the 2024 annual record, up 4.1 percent.
Mexico News Daily attributes this growth to declining domestic production and increasing demand for natural gas-fired electric power generation. Between January and May 2025, output from Petróleos Mexicanos (Pemex) fell 6.3 percent year-over-year to 3.5 Bcf per day, marking the second consecutive annual decline in production volumes. For the week ending August 28, additional pipeline flow data from S&P Global indicate:
- Canadian imports fell 5.2 percent week-over-week and 25.1 percent year-over-year.
- Exports to Mexico were up 3.6 percent relative to the same week last year, but down 3.2 percent compared to last week.
Natural Gas Rig Count Remains Strong
Baker Hughes reports 538 active rigs in the U.S. for the week ending August 22, down one from last week and 47 rigs compared to last year. The year-over-year decline is driven by a loss of 72 oil rigs, while the number of natural gas rigs increased by 25 rigs over the same period.
Storage Inventory Surplus to Five-Year Average Narrows
The EIA reported net injections into underground storage of 18 Bcf for the week ending August 22, bringing total inventories to 3,217 Bcf. Inventories are now 5 percent higher than the five-year average, marking the second consecutive week of a shrinking surplus. For the week ending August 15, inventories were 5.8 percent higher than the five-year average, down from a 6.6 percent surplus the week prior. Compared to the same week last year, current inventories as of August 22 are 3.4 percent lower.
Regionally, all regions except the East and Midwest posted inventories above the five-year average, with the Mountain region having the largest surplus of 23.3 percent. Compared to year-ago levels, inventory levels in all regions except the Pacific and South Central are lagging by up to 8.2 percent in the Midwest. The Pacific currently has the largest surplus relative to year-ago inventories of nearly 4 percent.
What to Watch:
- Production: Might record-level output contribute to infrastructure or storage bottlenecks, or will export demand continue to offset softening domestic consumption?
- Demand: With NOAA’s early September forecast, could warmer conditions in the Gulf Coast and West offset weaker demand in the East?
- Pipeline flows: With natural gas fueling 60 percent of Mexico’s electricity generation and declining production in the country, could Mexico’s reliance on U.S. natural gas exports continue to grow?
For questions please contact Juan Alvarado | jalvarado@aga.org, Liz Pardue | lpardue@aga.org, or
Lauren Scott | lscott@aga.org
To be added to the distribution list for this report, please notify Lucy Castaneda-Land | lcastaneda-land@aga.org
NOTICE
In issuing and making this publication available, AGA is not undertaking to render professional or other services for or on behalf of any person or entity. Nor is AGA undertaking to perform any duty owed by any person or entity to someone else. Anyone using this document should rely on his or her own independent judgment or, as appropriate, seek the advice of a competent professional in determining the exercise of reasonable care in any given circumstances. The statements in this publication are for general information and represent an unaudited compilation of statistical information that could contain coding or processing errors. AGA makes no warranties, express or implied, nor representations about the accuracy of the information in the publication or its appropriateness for any given purpose or situation. This publication shall not be construed as including advice, guidance, or recommendations to take, or not to take, any actions or decisions regarding any matter, including, without limitation, relating to investments or the purchase or sale of any securities, shares or other assets of any kind. Should you take any such action or decision; you do so at your own risk. Information on the topics covered by this publication may be available from other sources, which the user may wish to consult for additional views or information not covered by this publication.
Copyright © 2025 American Gas Association. All rights reserved.Natural Gas Market Indicators – June 6, 2025