Natural Gas Market Indicators – December 11, 2025
498 editions (and counting!) of data, trends, and natural gas market insights. NGMI’s 500th edition will launch in January 2026. Thank you for being part of the journey!
Natural Gas Market Summary
An early start to the winter heating season has brought the coldest temperatures in four years and unprecedented residential and commercial demand. The U.S. saw the highest natural gas demand on record for the 14-day period between November 27 and December 10. Similarly, industrial and power sector natural gas requirements over the same period are the highest on record. Of course, with the cold snap came a temporary rise in natural gas prices. Heating requirements remain the primary driver of natural gas demand at this time of year, so weather forecasts are likely to be an important near-term driver of pricing. Henry Hub prompt-month futures posted prices above $5.20/MMBtu in the early days of December before falling quickly back to the mid-$4 range as weather forecasts for the end of December appear to be trending warmer. While total demand, including exports, continues to outpace year-ago levels and is on track to set new annual records, natural gas production is expected to set a record in 2025, based on current trends. With flowing gas supplies complemented by above-average storage and Canadian pipeline imports, the U.S. is well-positioned with supply to meet consumer demand this winter heating season.
Prices Hit Three-Year High
November 26 marked the December futures contract rollover at the Henry Hub. On its first day as the prompt month, the January contract settled at $4.56 per MMBtu, up 3 percent from the December expiry. Over the following six trading days, the prompt month rose $0.73, reaching $5.29 per MMBtu on December 5 amid colder temperatures, representing the highest prompt-month price since mid-December 2022. As of December 10, the prompt month price had fallen to $4.60 per MMBtu, up less than 1 percent since rollover. Intraday on Thursday, the January contract traded lower, nearing $4.30 per MMBtu at the time of writing.
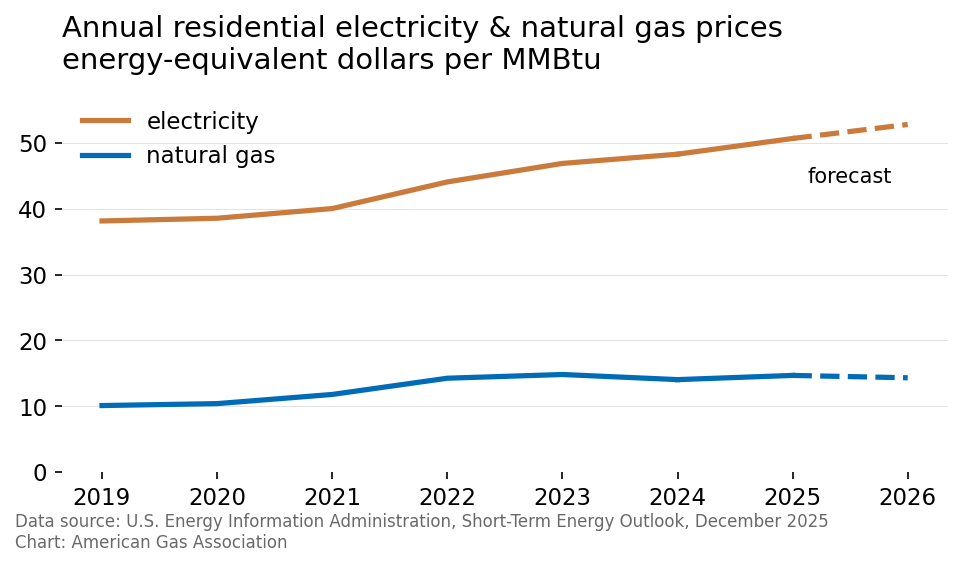
The December Short-Term Energy Outlook from EIA raised its winter spot price forecast to an average of almost $4.30 per MMBtu due to the colder start to the winter. However, the average 2026 spot price only rose 1 cent to $4.01 per MMBtu. Notably, the residential retail natural gas rates are expected to decline in 2026, reflecting regional supply availability and pricing trends. Retail electricity rates are expected to rise next year.
Forecast Shows Early Winter Chill Easing Across Much of the Lower-48
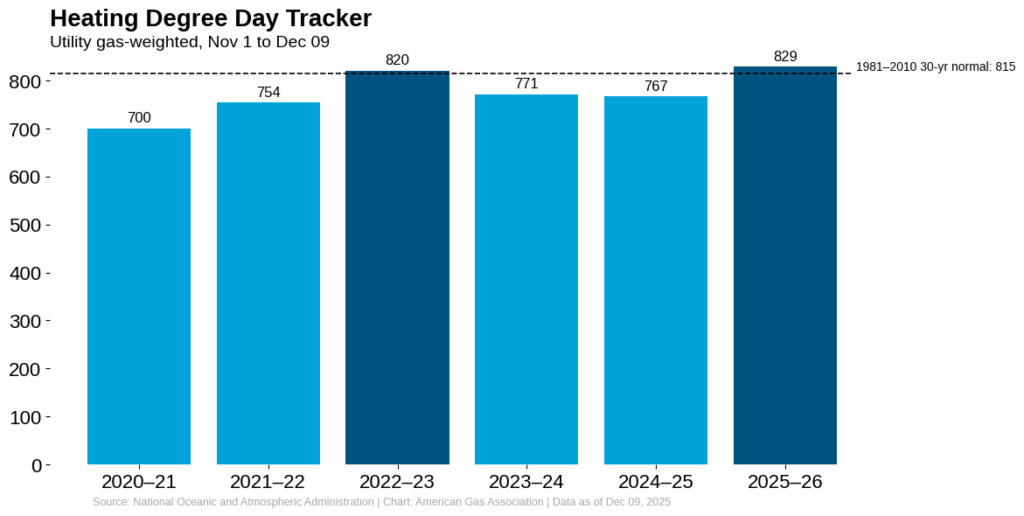
The first month of the winter heating season is over and brought with it extraordinary cold across the country. November temperatures were 6.5 percent colder than last year but 8.8 percent warmer than the 30-year normal, according to gas-weighted heating degree days (HDDs). However, December temperatures have been much colder, with temperatures 6.3 percent colder than last year and 23.9 percent colder than normal for the week ending December 6. Across all regions except the Pacific, temperatures were colder than normal, ranging from 5.2 percent below normal in the Mountain region to 46.2 percent below normal in the West South Central.
Into late-December, the National Oceanic and Atmospheric Administration’s Climate Prediction Center expects cooler-than-normal temperatures to ease across much of the country. The 8- to 14-day outlook indicates elevated chances of above-normal conditions over most of the lower 48 and Hawaii, with probabilities reaching 90 to 100 percent in portions of the Southwest, Southern Rockies, and Southern Plains. Near-normal temperatures are favored along a narrow corridor from the northern High Plains into the Upper Midwest, while below-normal conditions are expected to persist along the far northern tier from the northern Great Lakes into northern New England and across Alaska.
2025 Demand Expected to Reach Record Highs
Domestic natural gas demand remains on track to set a new annual record. Between January and November, year-to-date consumption is averaging 90.4 Bcf per day, 1.9 percent above the same period in 2024, according to data from Rystad Energy. Gains have largely been driven by the commercial and industrial sectors, with current demand outpacing historical highs by 1.8 and 1.1 percent, respectively.
Through December, Rystad forecasts 2025 domestic demand to reach 91.7 Bcf per day, which would be nearly 2 Bcf per day, or 1.5 percent higher than the 2024 record. Including pipeline and LNG exports, natural gas demand is expected to reach 112 Bcf per day, surpassing the 2024 record by 3.8 percent.
Natural Gas Production on Track for New Annual Record
According to preliminary data from S&P Global, dry natural gas production for the month to date through December 10 is up 1.8 percent relative to the same period in November and 4.5 percent higher than the same period last year. For the year to date, natural gas production is up 4.3 percent year-over-year.
Record-Breaking LNG Feedgas Volumes in 2025
LNG feedgas flows to U.S. export terminals are closing in on 20 Bcf per day after a record-setting year. According to data from Rystad Energy, the daily feedgas record of 15.2 Bcf per day set in December 2023 held through 2024. Since that time, the previous record has been surpassed by 23 new records so far in 2025 alone. Most recently, deliveries reached roughly 19.2 Bcf per day on November 26, about 2 percent above the prior record of 18.8 Bcf per day set on November 15. Feedgas flows remained elevated through the end of the month, matching that daily record on November 28. In December, deliveries have climbed even higher, with feedgas volumes reaching an all-time high of about 19.4 Bcf per day on both December 4 and December 5—roughly 27 percent above the December 2023 peak.
Storage Inventories Lower on Early December Withdrawals
Colder temperatures in early December led to the largest weekly withdrawal from underground storage since February 2025. For the week ending December 5, the EIA reported a net withdrawal of 177 Bcf, leaving lower 48 underground storage at 3,746 Bcf. Inventories now stand 2.8 percent above the five-year average but 0.7 percent below year-ago levels.
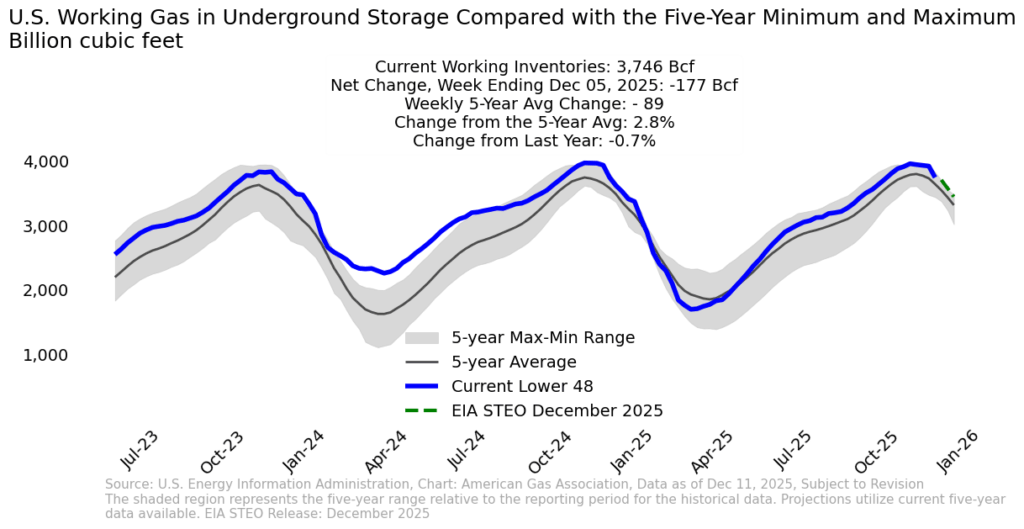
Withdrawals varied regionally, from 9 Bcf in the Pacific to 58 Bcf in the Midwest. The Mountain, Pacific, and South Central regions continue to hold surpluses relative to their five-year averages, while the East and Midwest remain slightly below normal. Compared with the same week in 2024, stocks are lower across all regions except the Pacific and South Central, which show modest surpluses of 1 percent and 2.5 percent.
Pipeline Trade Shows Mixed Cross-Border Flows
Pipeline trade moved in opposite directions for the week ending December 10. According to preliminary data from Rystad Energy, imports from Canada averaged 6.1 Bcf per day, up 7 percent from the previous week and 9.2 percent from a year ago. In contrast, exports to Mexico averaged 5.5 Bcf per day, down 1.1 percent week-over-week and 0.6 percent year-over-year.
Gas Rig Count Down by One for the Week
According to Baker Hughes, the number of U.S. natural gas rigs fell by one for the week ending December 5, bringing the total to 129. Compared to the same week last year, rig activity remains robust, up by 27 rigs, or 26.5 percent. Oil rigs increased by six week-over-week but are nearly 70 rigs, or 14.3 percent, lower than year-ago levels. Seven miscellaneous rigs for the week brought the total count to 549, nearly 7 percent lower year-over-year.
What to Watch:
- Production response: Expectations are that natural gas demand will continue to grow. However, there are differing views on the pace of production growth in 2026, which will further shape expectations for storage inventories and prices.
- Pipeline Flows: With Canadian imports strengthening and exports to Mexico easing, how will cross-border pipeline flows evolve as winter heating demand deepens?
- Storage: After the largest net withdrawal of the season to date, how might late-December weather patterns influence weekly withdrawals and regional balances heading into early 2026?
For questions please contact Juan Alvarado | jalvarado@aga.org, Liz Pardue | lpardue@aga.org, or
Lauren Scott | lscott@aga.org
To be added to the distribution list for this report, please notify Lucy Castaneda-Land | lcastaneda-land@aga.org
NOTICE
In issuing and making this publication available, AGA is not undertaking to render professional or other services for or on behalf of any person or entity. Nor is AGA undertaking to perform any duty owed by any person or entity to someone else. Anyone using this document should rely on his or her own independent judgment or, as appropriate, seek the advice of a competent professional in determining the exercise of reasonable care in any given circumstances. The statements in this publication are for general information and represent an unaudited compilation of statistical information that could contain coding or processing errors. AGA makes no warranties, express or implied, nor representations about the accuracy of the information in the publication or its appropriateness for any given purpose or situation. This publication shall not be construed as including advice, guidance, or recommendations to take, or not to take, any actions or decisions regarding any matter, including, without limitation, relating to investments or the purchase or sale of any securities, shares or other assets of any kind. Should you take any such action or decision; you do so at your own risk. Information on the topics covered by this publication may be available from other sources, which the user may wish to consult for additional views or information not covered by this publication.
Copyright © 2025 American Gas Association. All rights reserved.Natural Gas Market Indicators – June 6, 2025Natural Gas Market Indicators – November 24, 2025