Natural Gas Market Indicators – December 22, 2025
499 editions (and counting!) of data, trends, and natural gas market insights. NGMI’s 500th edition will launch in January 2026. Thank you for being part of the journey!
Natural Gas Market Summary
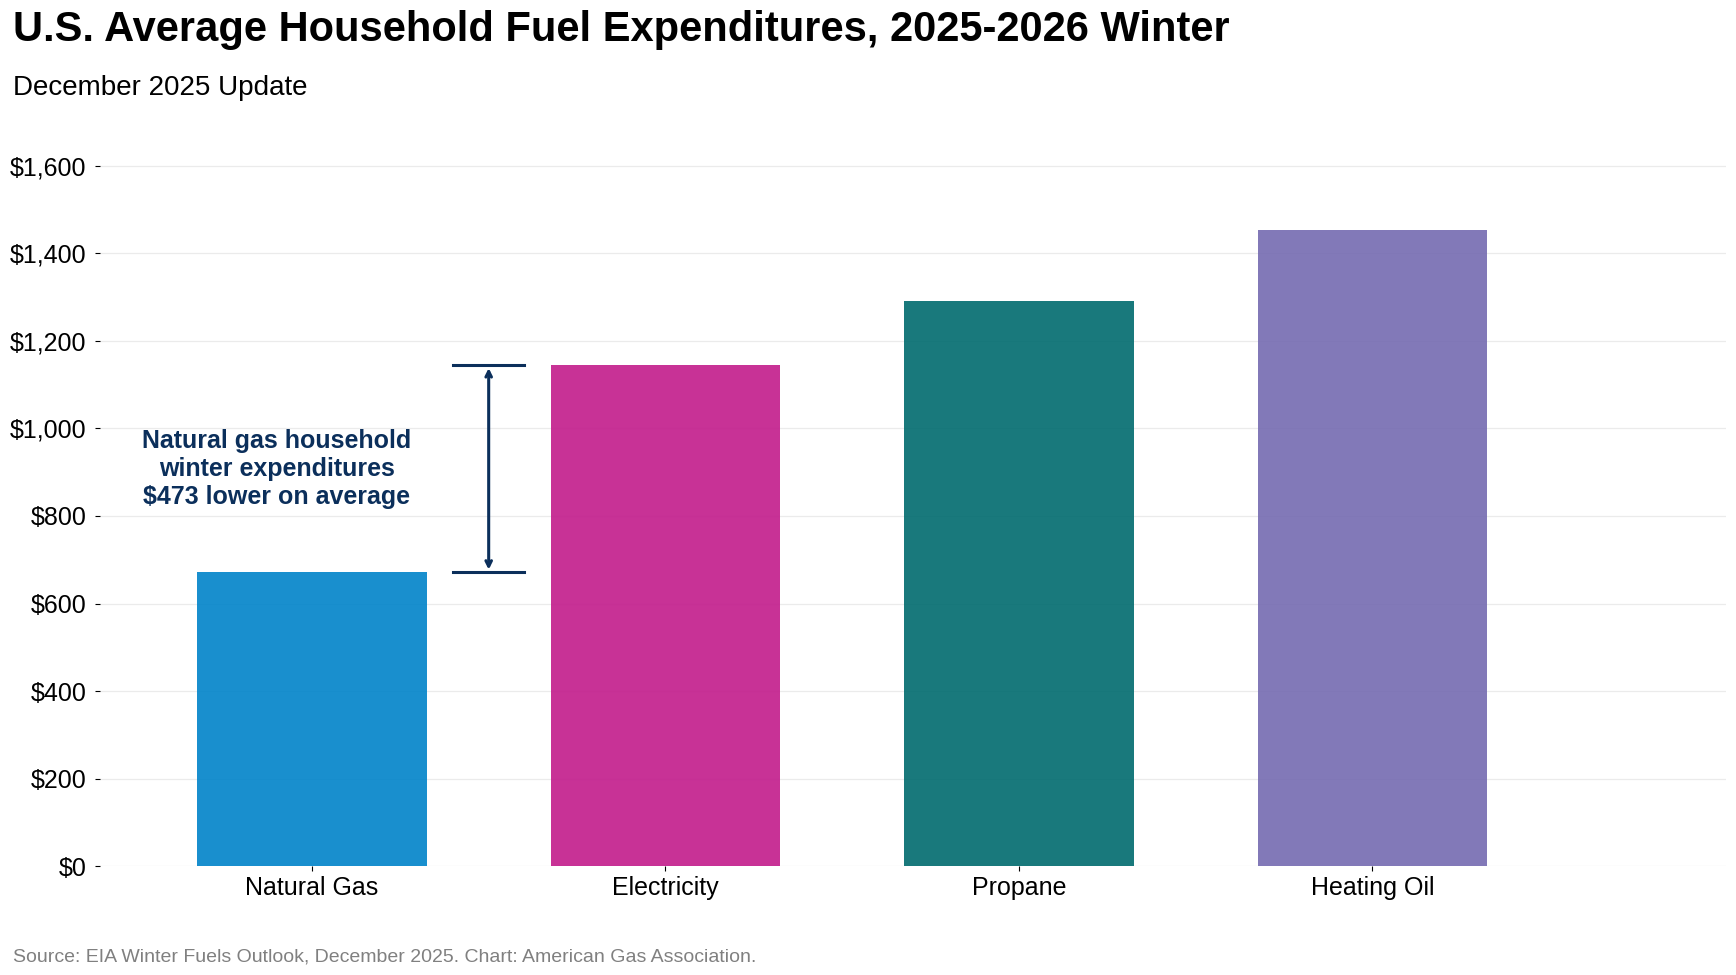
After an early December cold snap, natural gas demand has eased from recent highs and futures prices are retreating. Weather remains a key driver of shifting sentiment: although temperatures were still colder-than-normal in the most recent week, total heating degree days (HDDs) were 8.3 percent lower than the prior week, contributing to weaker gas consumption. Total demand, including exports, for the week ending December 22 fell 11.5 percent week-over-week but remains 1.2 percent higher than the same week last year, according to preliminary data from S&P Global Commodity Insights (S&P Global). As the holidays approach, forecasts point to milder weather, with expectations for warmer-than-normal conditions across the country. With storage inventories strong and production holding above 2024 levels, supply-side fundamentals are helping temper upward price pressure and supporting affordability for consumers. Although the EIA raised its estimated 2025-2026 winter energy expenditures amid expectations for colder temperatures and higher retail price forecasts, winter heating costs for natural gas-heated homes are still projected to be about 70 percent lower those heated with electricity.
Henry Hub Prices Retreat More Than $1 From Three-Year High
Henry Hub futures prices have softened since the start of the January prompt-month contract. The contract settled at $3.98 per MMBtu on December 19, down 12.6 percent from the start of the prompt month and nearly 25 percent lower than the three-year high of $5.29 per MMBtu on December 5. These pricing movements reflect weather-driven influences, with colder-than-normal temperatures in early December giving way to milder temperature forecasts and the anticipation of easing heating demand. Above-average inventories and steady production, which have reduced near-term supply concerns, have reinforced this pricing sentiment for the near-term. Prices returned to the $4 mark on Monday, with intraday highs on December 22 reaching around $4.14 per MMBtu at the time of writing.
The EIA continues to project that households heated with natural gas will face lower total heating costs this winter than those using electricity. In its December 15 Today in Energy analysis accompanying the Winter Fuels Outlook, the EIA noted that its 2025-2026 residential winter expenditure estimates have increased since the initial mid-October outlook, reflecting expectations for colder temperatures and higher retail energy price forecasts. Nevertheless, EIA’s latest average U.S. projections still show lower winter expenditures for natural gas-heated homes (i.e., $671) than for electricity-heated homes (i.e., $1,144), implying electricity-heated households are projected to spend about 70 percent more this winter.
Reprieve from Colder Temperatures May Be on the Horizon
Colder temperatures held strong into mid-December, but the U.S. is expected to enter 2026 warmer than normal. For the week ending December 20, temperatures in the U.S. were 15.1 percent colder than last year and 2.5 percent colder than the 30-year normal, according to gas-weighted HDDs. On a cumulative basis since the week ending October 4, temperatures in the U.S. have been 12.8 percent colder than last year but 5.7 percent warmer than normal. The current temperature probability outlook from the National Oceanic and Atmospheric Administration’s Climate Prediction Center indicates a moderate to high likelihood of above-normal temperatures across much of the U.S. and Hawaii into the first week of the new year. The West Coast, New England, and Alaska are expected to lean below- or near-normal during this time, with the probability of below-normal temperatures reaching at least 70 percent for the southern portion of Alaska.
Residential and Commercial Demand Higher on Colder Temps
According to preliminary data from S&P Global, total demand, including exports, is up 22.8 percent for the month to date through December 22 compared to the same period in November and 9.3 percent higher year-over-year. Bullish demand is being driven by increased residential and commercial sector consumption, which nearly doubled month-over-month and rose 11.4 percent year-on-year. On a year-to-date basis, total demand, including exports, is up 5.4 percent through December 22.
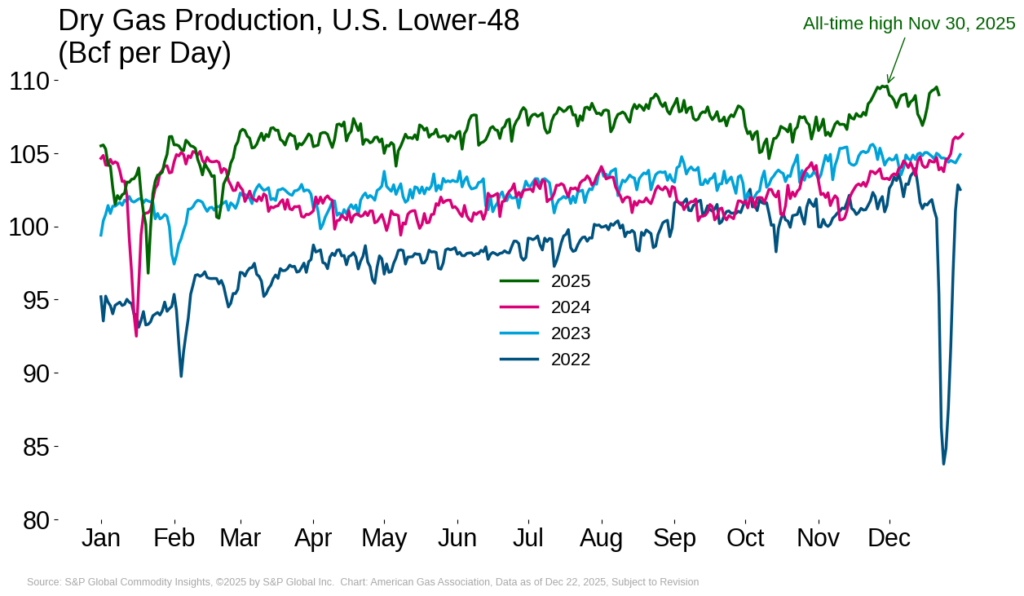
Production Holds Near Late-November Highs
After reaching an all-time daily high at the end of last month, U.S. natural gas production briefly dipped in mid-December but has since rebounded. As of December 22, output is 0.5 percent below its late-November peak, according to preliminary data from S&P Global, but remains 4.8 percent higher than the same period last year.
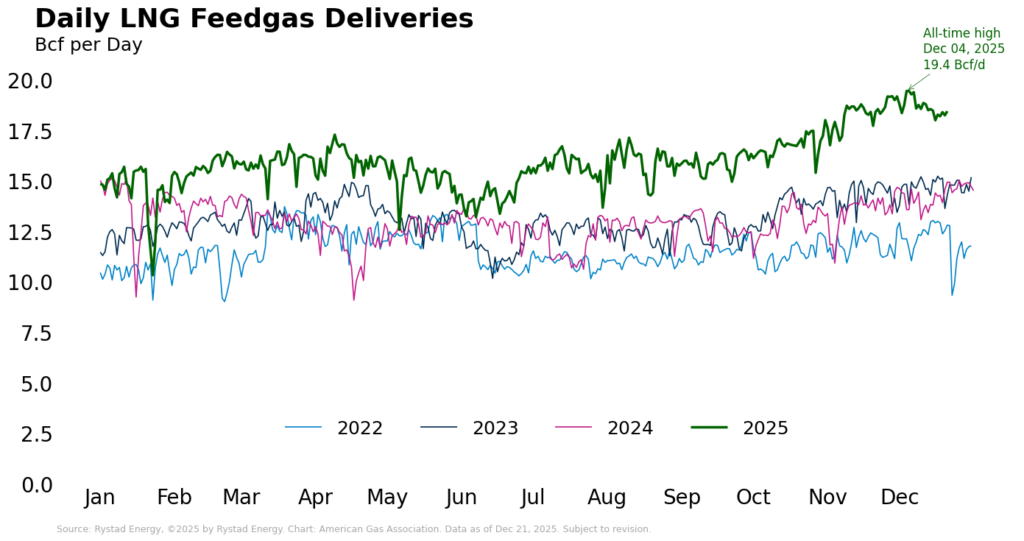
Record LNG Vessel Departures Reached in December
For the month to date through December 21, feedgas deliveries are 3.2 percent higher than the same period in November and 32.6 percent higher than the first three weeks of December 2024. Year to date, feedgas deliveries are up more than 23 percent, well on track for a new annual record.
From the perspective of LNG exports, 40 vessels departed the U.S. for the week ending December 10 according to shipping data reported by the EIA, setting a new weekly record. The vessels had a combined carrying capacity of 151 Bcf. According to the Pipeline and Gas Journal, the U.S. Department of Energy granted Woodside Energy’s Louisiana LNG facility a nearly four-year extension to commence exports. When finished, the project will have an export capacity of nearly 3.9 Bcf per day.
Regional Temperature Patterns Influence Storage Withdrawals
The EIA reports a net withdrawal from underground storage of 167 Bcf for the week ending December 12, lowering total inventories to 3,579 Bcf. Working gas stocks now stand 0.9 percent above the five-year average, but 1.7 percent lower than year-ago levels. Implied withdrawals from storage varied by region, ranging from a week-over-week percentage change between 0.7 percent in the Pacific to 6.2 percent in the Midwest. All regions except the East and Midwest remain above their five-year average. This regional divergence coincided with colder-than-normal weather in early December across parts of the central and eastern U.S. Relative to these five-year means, the Midwest holds the highest deficit at 4.7 percent while the Mountain region has the largest surplus at 21.5 percent.
Natural Gas Pipeline Imports Rises
Colder temperatures have impacted cross-border flows of natural gas in North America. According to preliminary data from Rystad Energy, natural gas imports from Canada are 26.7 percent higher for the month to date through December 21. Year-over-year, imports are 12 percent higher. By comparison, natural gas exports to Mexico are up 0.5 percent month-over-month but 0.7 percent below year-ago levels. For the year to date, imports from Canada are up 6 percent while exports to Mexico are 1 percent lower year-over-year.
Domestically, Algonquin Gas Transmission has proposed upgrades to its existing pipeline system to relieve Northeast capacity constraints and strengthen peak-day reliability, particularly during cold-weather demand, according to the Pipeline and Gas Journal. The project would rely on incremental improvements in or near existing rights-of-way, with construction anticipated later this decade pending regulatory approval.
Rig Activity Softens as Gas Rigs Decline
Rig count data from Baker Hughes show that total U.S. natural gas remained flat at 127 rigs for the week ending December 19. Compared with the same week last year, gas rigs are up 24.5 percent. Oil rigs declined by eight to 406 and remain down 15.9 percent year-over-year. Nine additional miscellaneous rigs brought the total U.S. rig count to 542, nearly 8 percent lower than last year.
What to Watch:
- Storage: December is off to a chilly start, but forecasts predict the U.S. will end the year with above-normal temperatures. Will it be enough to meaningfully slow withdrawals?
- LNG: Could LNG feedgas deliveries set another daily record before the end of 2025?
- Prices: Henry Hub futures fell roughly 25 percent from December 5 to 16. Is the market repricing winter fundamentals or positioning for renewed volatility?
For questions please contact Juan Alvarado | jalvarado@aga.org, Liz Pardue | lpardue@aga.org, or
Lauren Scott | lscott@aga.org
To be added to the distribution list for this report, please notify Lucy Castaneda-Land | lcastaneda-land@aga.org
NOTICE
In issuing and making this publication available, AGA is not undertaking to render professional or other services for or on behalf of any person or entity. Nor is AGA undertaking to perform any duty owed by any person or entity to someone else. Anyone using this document should rely on his or her own independent judgment or, as appropriate, seek the advice of a competent professional in determining the exercise of reasonable care in any given circumstances. The statements in this publication are for general information and represent an unaudited compilation of statistical information that could contain coding or processing errors. AGA makes no warranties, express or implied, nor representations about the accuracy of the information in the publication or its appropriateness for any given purpose or situation. This publication shall not be construed as including advice, guidance, or recommendations to take, or not to take, any actions or decisions regarding any matter, including, without limitation, relating to investments or the purchase or sale of any securities, shares or other assets of any kind. Should you take any such action or decision; you do so at your own risk. Information on the topics covered by this publication may be available from other sources, which the user may wish to consult for additional views or information not covered by this publication.
Copyright © 2025 American Gas Association. All rights reserved.Natural Gas Market Indicators – June 6, 2025Natural Gas Market Indicators – November 24, 2025