Natural Gas Market Indicators – February 19, 2026
Natural Gas Market Summary
Winter Storm Fern and the subsequent extreme cold weather in late January served as a national-level stress test for the U.S. energy system. The storm plunged temperatures well below freezing across much of the U.S., contributing to record cold and sustained sub-zero conditions over a vast swath of the country as the storm moved from the southern Plains into the Northeast and affected tens of millions of Americans. According to the National Oceanic and Atmospheric Administration (NOAA), Seagull, Minnesota, saw temperatures as low as negative 43°F, resulting in substantial spikes in energy demand.
As markets continue to normalize and temperatures continue to moderate into mid-February, the natural gas system’s resilience cannot be overstated. Despite the extreme cold-driven demand and record storage withdrawals pushing Henry Hub spot market prices to an all-time high of $30.72 per MMBtu on January 23, prices quickly returned to typical seasonal ranges. As of February 18, prompt-month futures are hovering around $3.00 per MMBtu, while the spot market settled at $3.25 per MMBtu on February 9. Near-term price risk remains tied to late-season cold, incremental storage draws, and the potential for weather-driven production disruptions.
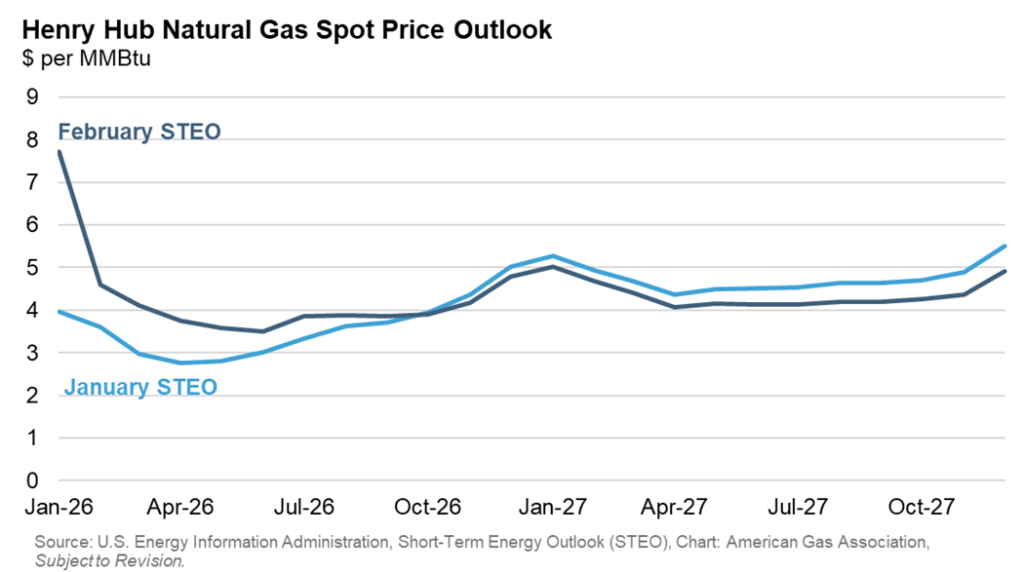
Looking ahead, the Energy Information Administration’s (EIA) February Short-Term Energy Outlook (STEO) forecasts Henry Hub spot prices to average about $4.30 per MMBtu in 2026. Themes of rapid recovery are also reflected in the STEO’s expectations for production and underground storage. Even with softer January production and current storage inventories 5.6 percent below the five-year average, the STEO projects that 2026 production could average more than 120 Bcf per day and that inventories may enter the 2026-2027 heating season approximately 5 percent above the five-year average.
Steadier Pricing Trends Post-Storm
The March Henry Hub natural gas futures contract settled at $3.01 per MMBtu on February 18, down 59.7 percent from the near-term high of $7.46 per MMBtu on January 28 during Winter Storm Fern. Month to date through February 18, prompt-month settlements averaged $3.23 per MMBtu and have traded within a relatively tight range, between $3.01 and $3.51 per MMBtu, suggesting steadier near-term pricing expectations than those seen in January as the winter heating season winds down.
In its February update to the STEO, the EIA raised its 2026 Henry Hub spot price outlook while lowering expectations for 2027. EIA now forecasts Henry Hub spot prices could average $4.60 per MMBtu in February and $4.12 per MMBtu in March, up 32.8 percent and 43.7 percent, respectively, from the January STEO forecasts. The EIA attributes the upward revision to lower working gas inventories following the record withdrawal during Winter Storm Fern. As a result, the EIA anticipates that higher 2026 prices could incentivize additional production, potentially contributing to lower prices in 2027. Annually, the February STEO projects Henry Hub spot prices to average $4.31 per MMBtu in 2026, an increase of nearly 25 percent from the January forecast. The STEO revised the 2027 spot price forecast downward to $4.38 per MMBtu, a reduction of 4.5 percent.
Milder Temperatures to Close Out February
In contrast to the extreme cold conditions across much of the U.S. in late January, temperatures for the first half of February have moderated. For the week ending February 14, U.S. temperatures were 16.2 percent warmer than the previous year and 9.3 percent warmer than the 30-year normal, according to population-weighted heating degree days (HDDs). Regionally, all areas were warmer than both last year and normal conditions except New England and the Middle and South Atlantic.
Into early March, NOAA projects above-normal temperatures for most of the continental U.S., with probabilities reaching as high as 80 percent in portions of the Midwest through March 4. Pacific Coast states from Washington to Northern California are expected to have near-normal conditions during this time. Meanwhile, the Alaskan temperature outlook is below normal for this period, with probabilities extending above 80 percent for much of the State.
Demand Declines on Mild Temperatures
Warmer-than-normal temperatures across the U.S. have calmed space-heating-driven natural gas demand. Preliminary data from S&P Global Energy indicate that for the week ending February 19, total natural gas demand, including exports, fell 10.9 percent relative to last week and declined 18.5 percent relative to the same week last year. By sector, the decline was led by residential and commercial consumption, which dropped 25.3 percent week-over-week and 40.6 percent year-over-year. Industrial and power sector demand also declined on both a weekly and annual basis, but by smaller margins
Production Projected to Reach More Than 120 Bcf per day in 2026
For the month of January, natural gas production in the U.S. averaged 104.4 Bcf per day, with the freeze-offs during Winter Storm Fern having a 3.3 Bcf per day downside impact, according to Rystad Energy. As of February 19, production levels have recovered, sitting at roughly 108 Bcf per day. For the week ending February 19, U.S. dry natural gas production is up 0.9 percent week-over-week and 5.8 percent year-over-year, according to data from S&P Global Energy.
In the near-term, both Rystad Energy and EIA forecasts anticipate production growth in 2026. The February STEO projects that natural gas marketed production could increase by 2 percent to 120.8 Bcf per day in 2026, with over half of the growth driven by activity in the Appalachian, Haynesville, and Permian regions.
Feedgas Flows Average Nearly 19 Bcf per Day
Rystad Energy reports reduced feedgas demand during Winter Storm Fern resulted from domestic natural gas market prices spiking above LNG free on board (FOB) prices, incentivizing the redirection of feedgas into the domestic market. Offtakers with tolling agreements, such as Shell at Elba Island, and merchant-style LNG developers with storage supply, like Cheniere, were among those who redirected feedgas to serve domestic demand.
With domestic prices moderating post-storm, feedgas flows have returned to pre-storm levels. LNG feedgas deliveries averaged 18.8 Bcf per day for the week ending February 18, an increase of 19.7 percent (3.1 Bcf per day) over the same week last year and 0.4 percent (0.1 Bcf per day) over last week, according to data from Rystad Energy.
Storage
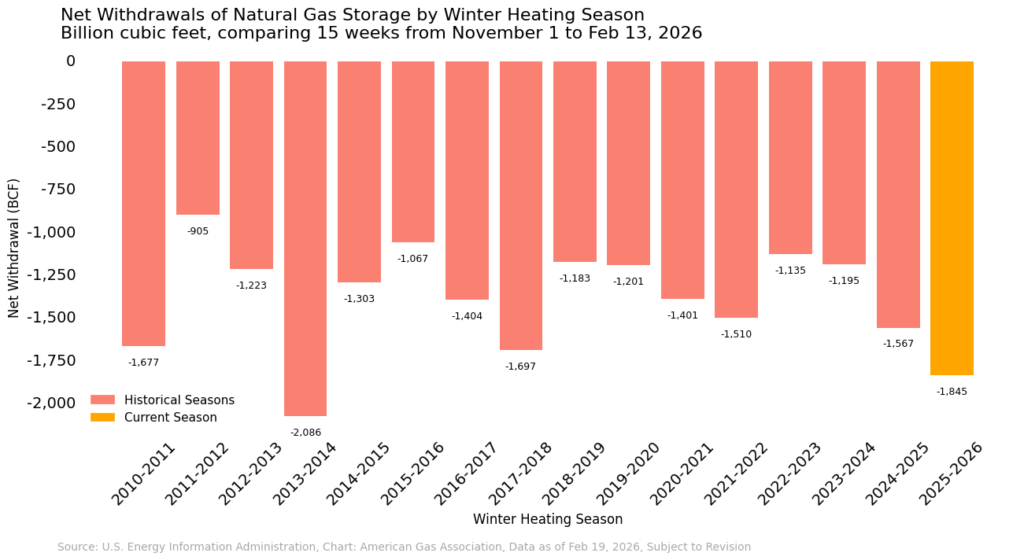
Net withdrawals from natural gas underground storage assets have eased following Winter Storm Fern. After a record net withdrawal of 360 Bcf for the week ending January 30, the EIA reports that net withdrawals from working gas stocks slowed to 249 Bcf for the week ending February 6 and 144 Bcf for the week ending February 13. From November 1 through February 13, cumulative net withdrawals of 1.8 Tcf rank as the second largest since at least 2010, trailing the 2013-2014 winter by 14.3 percent.
Lower 48 inventories remain slightly above 2 Tcf for the week ending February 13, sitting 5.6 percent below the five-year average and 2.8 percent below year-ago levels. Storage levels in the East, Midwest, and South Central regions remain below their respective five-year averages and inventories during the same week last year, with the Midwest posting the largest overall deficit at 18.4 percent below the regional five-year average.
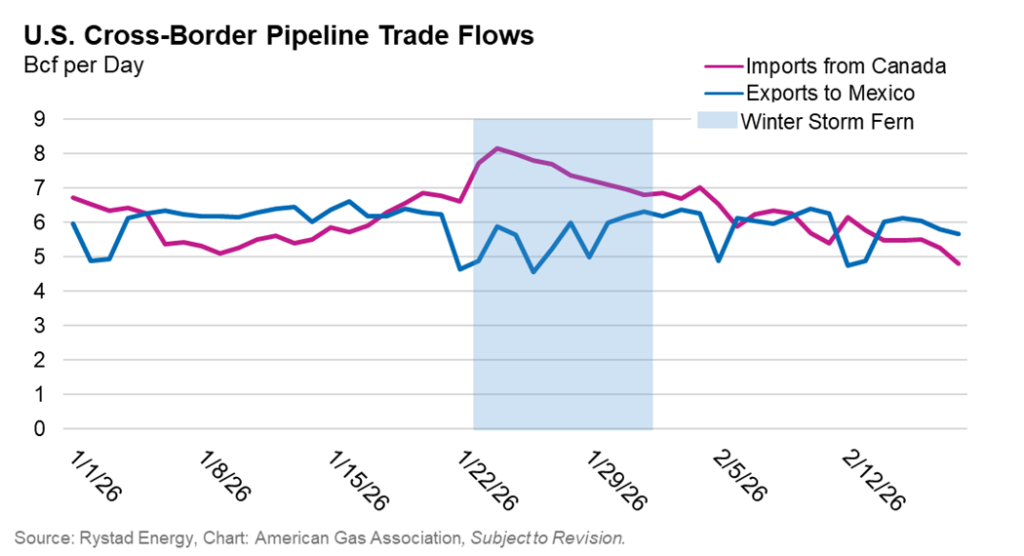
Cross-Border Flows Normalize in February
From January 1 through 21, Canadian imports averaged 5.9 Bcf per day and exports to Mexico averaged 6.1 Bcf per day, according to data from Rystad Energy. From January 22 to 31, the height of Winter Storm Fern, imports from Canada rose 25.6 percent and exports to Mexico fell 11.8 percent. Month to date through February 18), trade has largely returned to pre-event levels, with imports falling to an average of 6.0 Bcf per day and exports to Mexico climbing to an average of 5.9 Bcf per day.
Gas Rig Count Rises Over Last Week
Baker Hughes’ North America Rig Count Report for the week ending February 13 indicates U.S. natural gas rigs increased by three week-over-week to 133 and are up by 31.7 percent (32 rigs) year-over-year. Oil rigs declined by three over last week and miscellaneous rigs remained flat, leaving total rig count unchanged at 551.
The February STEO expects strong natural gas rig activity to continue in 2026. With its price outlook revised higher following storage drawdowns during Winter Storm Fern, the EIA anticipates current market conditions may encourage more natural gas-directed drilling, supporting its production outlook.
What to Watch:
- Weather: With Winter Storm Fern in the rear-view mirror, the market’s focus turns to what’s ahead. Could another late-winter storm materialize, or will summer heat be the next major stress test for the U.S. energy system?
- Storage: With about six weeks of the winter heating season remaining, will the domestic market see another significant drawdown before the shoulder season begins?
- LNG: Winter Storm Fern helped highlight LNG’s flexibility as feedgas was redirected back into the domestic market. How might this optionality shape contingency planning ahead of the next severe weather event?
For questions please contact Juan Alvarado | jalvarado@aga.org, Liz Pardue | lpardue@aga.org, or Lauren Scott | lscott@aga.org
To be added to the distribution list for this report, please notify Lucy Castaneda-Land | lcastaneda-land@aga.org
Notice
In issuing and making this publication available, AGA is not undertaking to render professional or other services for or on behalf of any person or entity. Nor is AGA undertaking to perform any duty owed by any person or entity to someone else. Anyone using this document should rely on his or her own independent judgment or, as appropriate, seek the advice of a competent professional in determining the exercise of reasonable care in any given circumstances. The statements in this publication are for general information and represent an unaudited compilation of statistical information that could contain coding or processing errors. AGA makes no warranties, express or implied, nor representations about the accuracy of the information in the publication or its appropriateness for any given purpose or situation. This publication shall not be construed as including advice, guidance, or recommendations to take, or not to take, any actions or decisions regarding any matter, including, without limitation, relating to investments or the purchase or sale of any securities, shares or other assets of any kind. Should you take any such action or decision; you do so at your own risk. Information on the topics covered by this publication may be available from other sources, which the user may wish to consult for additional views or information not covered by this publication.
Copyright © 2025 American Gas Association. All rights reserved.