Natural Gas Market Indicators – July 3, 2025
Natural Gas Market Summary
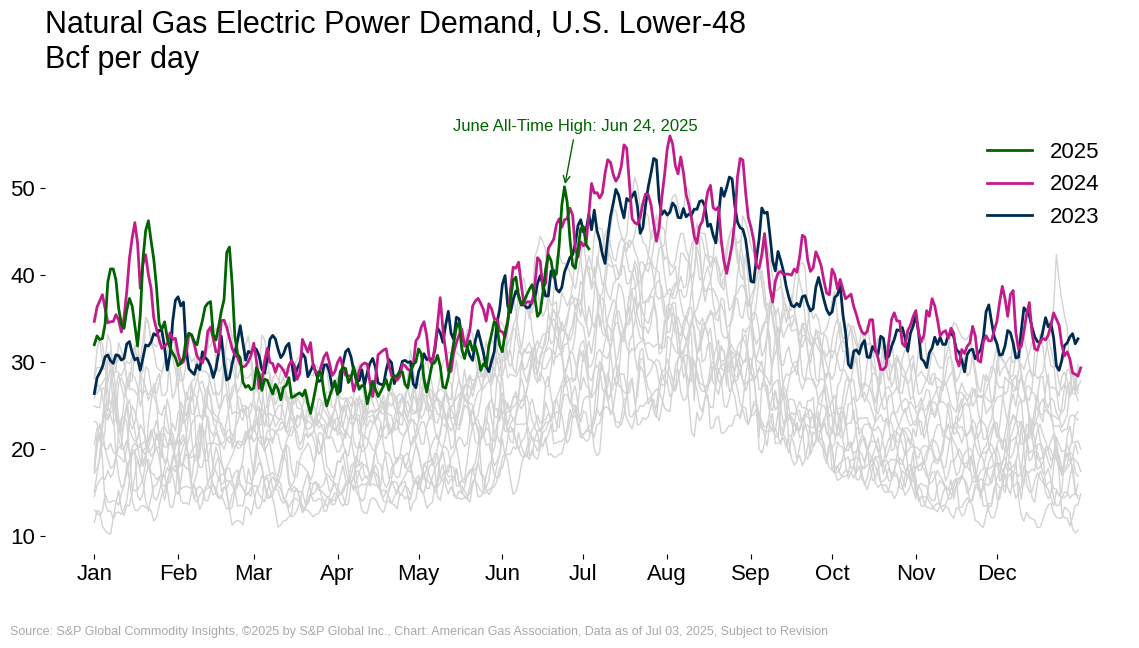
Late June brought scorching heat across much of the U.S., as a heat dome engulfed tens of millions of people in the central and eastern states between June 21 and 24, according to NASA. Seven states in the Northeast tied or broke monthly high temperature records on June 24. The heat dome heightened cooling demand loads and contributed to strained grid operations for PJM Interconnection and Midcontinent Independent System Operator (MISO). Both operators issued several emergency alerts between June 23 and 26, including Maximum Generation Alerts.
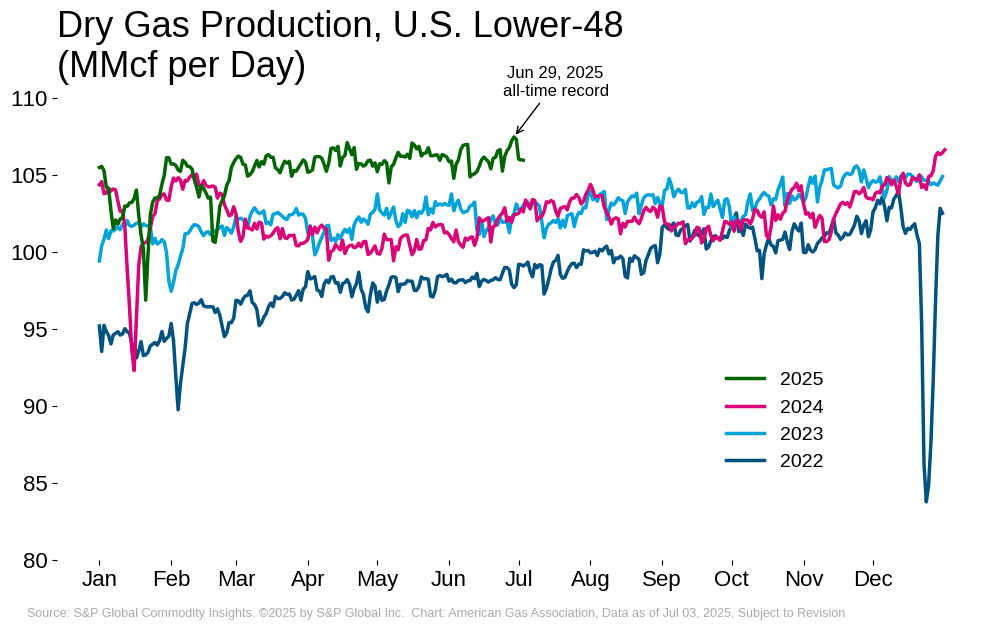
Amid periods of high electricity demand, natural gas remains a critical energy source for power generation. The EIA reports that natural gas supplied 44 percent of PJM’s generation and 47 percent of ISO-New England during peak load periods during the June heat wave. Natural gas volumes consumed in the electric power sector reached record highs for late June. The June 24 total surpassed the previous record—set on June 25, 2024—by 6.6 percent, according to data from S&P Global Commodity Insights (S&P Global). LNG feedgas remains strong, up nearly 20 percent year-to-date relative to the same period in 2024. Dry gas production reached new highs on June 29, reflecting the higher gas rig count year-over-year.
Henry Hub Futures Up Week-over-Week
The Henry Hub prompt month price reached nearly $4 per MMBtu in the middle of June before falling through the end of the July contract. According to CME, the July prompt-month contract at the Henry Hub closed at $3.26 per MMBtu on June 26, its last trading day. By the next day, the prompt-month price rose 15 percent following the rollover to the August contract. As of July 2, the Henry Hub prompt-month price is up 2.4 percent week-over-week.
The natural gas market experienced increased pricing in June, with the average Henry Hub prompt-month price of $3.64 per MMBtu exceeding the May 2025 average by 5.3 percent. June’s average prompt month was nearly 30 percent higher than the same month last year. Daily Henry Hub spot prices increased nearly 9 percent from the first to the last trading day in June. By comparison, the average spot price of $3.02 per MMBtu for the month was 3 percent lower than the May 2025 average.
Argus reports the following regional natural gas spot prices as of June 30:
- The highest regional price occurred in Louisiana and the Southeast at $3.27 per MMBtu.
- The Rockies and Northwest had the lowest regional price at $2.60 per MMBtu.
- Regional prices in other areas ranged from $2.74 per MMBtu in Appalachia to $3.27 per MMBtu in the Northeast.
June Heat Expected to Persist in July
Temperatures across the U.S. maintained above-normal conditions during the final week of June, influencing cooling-driven demand in the power sector. For the week ending June 28, population-weighted cooling degree days (CDDs) totaled 85, flat year-over-year but 42 percent above the 30-year normal. All regions except the Mountain and Pacific were warmer than normal. Pacific region CDDs fell to 19, down 64 percent from last year and 37 percent below normal, reflecting mild conditions on the West Coast. Comparatively, the East North Central region posted 103 CDDs for the week, 61 percent above 2024 levels and 140 percent above normal, underscoring regional heat intensity across the Midwest.
Looking ahead, the National Oceanic and Atmospheric Administration (NOAA) expects hotter conditions to continue through much of the lower 48 into mid-July. In the 8–14 day temperature outlook, above-normal temperatures are forecast to cover the East and West Coast, with the highest probability for above-normal heat in the Mountain and South Atlantic regions. In the central U.S., a pocket of near-to-below-normal temperatures are expected into mid-July. While the forecast may temper cooling demand in parts of the Midwest, the remainder of the country is likely to sustain strong cooling demand loads in the near term.
As of July 3, NOAA’s National Hurricane Center reports that Hurricane Flossie has weakened into a tropical storm in the Eastern Pacific off the coast of southwestern Mexico. Current models anticipate that the cyclone will dissipate within 60 hours as it moves northwest. While NOAA has flagged two disturbances in the Eastern Pacific and Atlantic, no additional named systems are active as of the time of this writing. One disturbance along the coast of the southeastern U.S. has a 60 percent chance of developing into a cyclone within the next seven days as the system shifts northward.
Daily Demand Forecast to Rise into July
For the month of June, Rystad Energy reports that daily U.S. natural gas consumption averaged 77.2 Bcf per day, an increase of 3.1 Bcf per day over May 2025 demand. Power sector demand accounted for 38.4 Bcf per day, or 49.8 percent, of total natural gas demand. Comparatively, the share of total demand in the industrial, commercial, and residential sectors was 28.1 percent, 6.1 percent, and 4.8 percent, respectively. Despite record daily electric power demand in late June, monthly average demand fell year-over-year by 3.1 Bcf per day. As July begins, Rystad forecasts that monthly demand will reach an average of 87.2 Bcf per day, driven by electric power consumption at 49.1 Bcf per day. Compared to the July 2024 all-time monthly demand record of 88.8 Bcf per day, this is a difference in daily natural gas consumption of only 1.6 Bcf.
New Production Record Set in June
U.S. natural gas production set a new daily record on June 29 and nearly set a new monthly production record as the first half of 2025 came to a close, according to preliminary data from S&P Global. Production in the lower 48 posted an increase of 0.4 percent for the week ending July 3. Year-over-year, output is 4 percent higher.
LNG Exports Steady as Feedgas Volumes Improve
Between June 19 and June 25, 30 LNG vessels departed the U.S. with a combined carrying capacity of 113 Bcf, according to Bloomberg Finance L.P. data cited by the EIA. Similarly, 28 LNG vessels departed the U.S. last week with a combined carrying capacity of 114 Bcf.
For the week ending June 29, LNG feedgas deliveries increased by 0.9 Bcf per day, or 6.6 percent, over last week, according to preliminary data from Rystad Energy. Year-over-year, LNG feedgas deliveries are up 2.6 Bcf per day, or 20.7 percent. Feedgas volumes are beginning to improve as routine maintenance at Cheniere’s Sabine Pass and Corpus Christi plants concludes. As of June 29, daily feedgas deliveries are 13 percent lower than the record daily high of 17.3 Bcf set on April 9, 2025, according to preliminary data from Rystad Energy. On a month-to-date basis, feedgas deliveries are down 0.8 Bcf per day (5.5 percent) relative to the monthly average through May 29.
U.S. LNG exports to Asia could increase with the recent agreement between PTT Group and Glenfarne’s Alaska LNG project. PTT will procure 2 million metric ton (MMt) of LNG per year for 20 years, increasing U.S. LNG exports to Thailand, according to Reuters. Thailand’s Finance Minister Pichai Chunhavajira stated that the country also planned on importing more U.S. LNG over the next five years. In international news, LNG Canada shipped its first LNG cargo on June 30. The Kitimat, British Columbia, facility is the country’s first global LNG export facility and provides access to the Asian markets via the Pacific Ocean. According to Reuters, the terminal will have a 14 MMt annual capacity.
Underground Storage Inventories Return to Mid-January Levels
The refill season continues its rapid pace with cumulative net injections since April 1 at the highest level since at least 2019. According to the EIA, U.S. underground storage inventories for the week ending June 27 stood at 2,953 Bcf, following a 55 Bcf net injection for the week. Total storage inventories for the week slipped slightly relative to the five-year average, up 6.2 percent compared to a 6.6 percent surplus for the previous week. Compared to year-ago levels, inventories lagged by 5.6 percent. Regionally, the Midwest had the largest year-over-year shortfall in storage inventories of 11.3 percent, while the Pacific posted a year-over-year surplus of 1.8 percent. Currently, storage levels in all areas are above the regional five-year averages, with the Mountain region having the largest surplus of 28.1 percent.
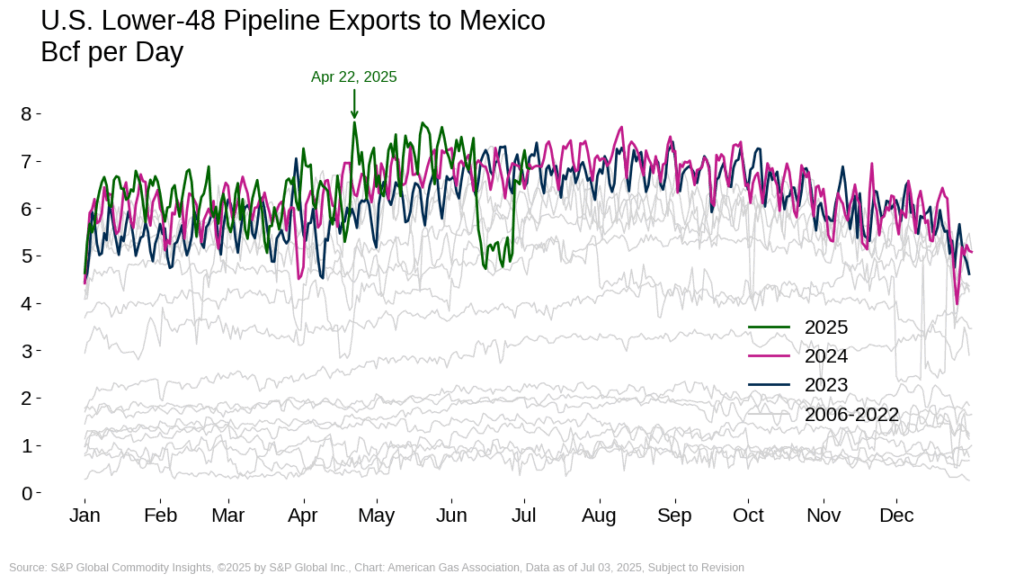
Exports to Mexico Down in June After April High
Natural gas imports from Canada increased by 4.2 percent week-over-week and 1.4 percent year-over-year for the week ending July 3, according to preliminary data from S&P Global. Exports to Mexico also increased over this period, rising 34.2 percent compared to last week. Year-over-year, exports to Mexico are back up by 0.5 percent, after declining in June as domestic demand climbed due to warmer-than-normal temperatures.
Domestically, conversations about new pipeline infrastructure are gaining traction. Reuters reports that several U.S. energy firms are exploring the possibility of expanding natural gas pipeline capacity in the Northeast. With many major pipelines in the region at or near full capacity, the ability to move gas from the Appalachian shale fields has been a limiting factor for production growth. In recent years, the regulatory and legal climate has delayed or cancelled future projects. However, shifting federal policies have renewed interest in projects in the Northeast after years of stalled progress.
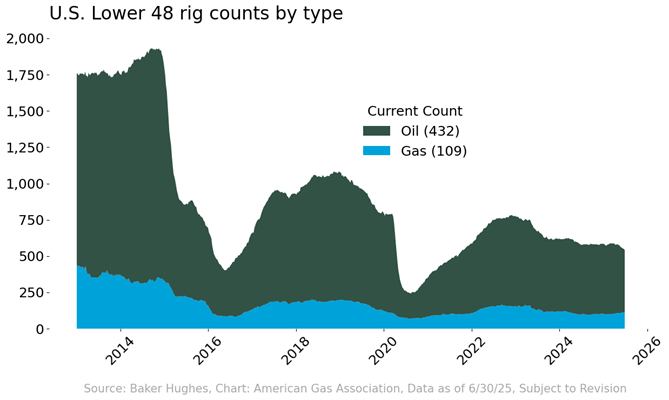
Gas Rig Count Remains Positive Year-over-Year Despite Persistent Reductions
U.S. rig activity continued to contract into late June. According to Baker Hughes, the total U.S. rig count declined by seven rigs week-over-week, landing at 547 rigs as of June 27. Compared to year-ago levels, the total count for the week is down by 34 rigs. A six-rig decrease in oil-directed rigs week-over-week drove the overall decline, representing 47 fewer rigs than the same week in 2024. By comparison, the number of gas rigs fell by two to 109 for the week but remained 12 higher year-over-year.
Recent rig trends are being influenced in part by uncertainty around oil prices. The Wall Street Journal reports that many drillers, including Permian Basin producers Diamondback Energy and EOG Resources, indicate plans to scale back spending in the second half of 2025. Meanwhile, Coterra Energy announced it will maintain its current rig count in the Permian Basin, reversing earlier plans to scale back, according to Reuters. Coterra CEO Tom Jorden tied the decision to improving confidence in oil prices. According to the EIA, the Permian Basin accounted for approximately two-thirds of associated gas production in 2023.
What to Watch:
- LNG Feedgas: With facilities returning to normal operations, will volumes return to April levels by the end of the year?
- Rig Count: How will associated gas production be impacted if the number of oil rigs continues to fall?
- Demand: Will the rising load amid the heat dome and persistent high temperatures strain the supply-demand balance?
For questions please contact Juan Alvarado | jalvarado@aga.org, Liz Pardue | lpardue@aga.org, or
Lauren Scott | lscott@aga.org
To be added to the distribution list for this report, please notify Lucy Castaneda-Land | lcastaneda-land@aga.org
NOTICE
In issuing and making this publication available, AGA is not undertaking to render professional or other services for or on behalf of any person or entity. Nor is AGA undertaking to perform any duty owed by any person or entity to someone else. Anyone using this document should rely on his or her own independent judgment or, as appropriate, seek the advice of a competent professional in determining the exercise of reasonable care in any given circumstances. The statements in this publication are for general information and represent an unaudited compilation of statistical information that could contain coding or processing errors. AGA makes no warranties, express or implied, nor representations about the accuracy of the information in the publication or its appropriateness for any given purpose or situation. This publication shall not be construed as including advice, guidance, or recommendations to take, or not to take, any actions or decisions regarding any matter, including, without limitation, relating to investments or the purchase or sale of any securities, shares or other assets of any kind. Should you take any such action or decision; you do so at your own risk. Information on the topics covered by this publication may be available from other sources, which the user may wish to consult for additional views or information not covered by this publication.
Copyright © 2025 American Gas Association. All rights reserved.Natural Gas Market Indicators – June 6, 2025