Natural Gas Market Indicators – July 31, 2025
Natural Gas Market Summary
Extreme heat is anticipated for the last week of the month, with portions of the Midwest, South, and Northeast at risk of dangerous heat indices above 103° Fahrenheit through at least Thursday. Dangerous heat indices are expected to continue into early August in portions of the South.
On July 29 at 6 PM, the U.S. set a new record of electricity demand in a single hour, reaching nearly 760 GWh of demand. Natural gas alone provided 46 percent of the peak generation. This record occurred at a time when sustained cooling demand during extreme heat conditions could add strain to the energy grid. On July 28, the U.S. Department of Energy granted an emergency request issued by the PJM Interconnection (PJM) to authorize a nearly 400-megawatt (MW) oil-fueled power plant located near Baltimore and owned by Talen Energy to operate beyond its normal limits due to the extreme heat affecting Eastern states. Utility Dive reports the unit was scheduled for decommissioning in May 2025 but had received Federal Energy Regulatory Commission approval to delay until 2029. PJM’s request cited an “imminent electric reliability emergency” that could lead to loss of service.
While planning for grid reliability challenges unfolded in the East, progress on U.S. LNG infrastructure continued along the Gulf Coast. On July 28, Venture Global announced a $15.1 billion final investment decision for Phase 1 of its Calcasieu Pass 2 (CP2) facility, which will be located adjacent to its existing Calcasieu Pass liquefaction plant in Louisiana. The project is expected to begin production in 2027 and will have a production capacity of 28 million tons per annum (MTPA). According to the Venture Global press release, along with Calcasieu Pass and Plaquemines, the CP2 project will bring Venture Global’s contracted capacity to 43.5 MTPA.
Natural Gas Futures Ease as August Contract Expires
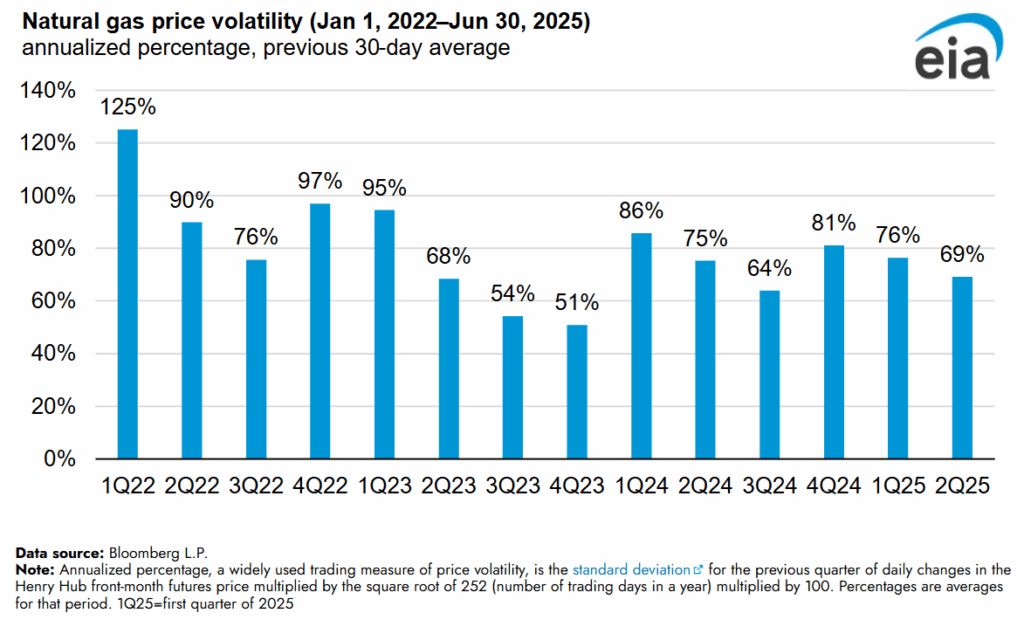
Henry Hub futures softened as the August prompt month came to a close. According to CME data, the prompt-month contract settled at $3.08 per MMBtu on July 29, down 5.3% week-over-week and nearly 10% since the start of July. The 12-month strip reached its lowest level since early January 2025 on July 28, before ticking slightly higher at expiry. The rollover to the September contract had little impact on pricing, with the new prompt month settling at $3.05 per MMBtu on July 30. The EIA reported the average historical volatility of Henry Hub prompt-month prices decreased during the first half of 2025, due in part to improved market stability as storage inventories rebalance. Price volatility declined seven percentage points to 69 percent between the first and second quarters of 2025, according to EIA’s analysis. Since at least the first quarter of 2022, second-quarter price volatility has consistently declined relative to the first quarter, reflecting a broader trend of more stable seasonal price movements, even during the coldest months.

Argus reports the following regional natural gas spot prices as of July 30:
- The highest regional price of $3.02 MMBtu occurred in Louisiana and the Southeast.
- The Southwest had the lowest regional price of $1.94 per MMBtu.
- Regional prices in other areas ranged from $2.18 per MMBtu in the Rockies and Northwest to $2.93 per MMBtu in the Northeast.
High Temps to Continue as Eastern Pacific Tropical Weather Outlook Develops
For the week ending July 26, temperatures in the U.S. were 12.2 percent warmer than last year and 10.7 percent warmer than the 30-year normal, according to Cooling Degree Day (CDD) data. All regions were warmer than last year and warmer than the 30-year normal except for the Mountain and Pacific. The East North Central and West North Central regions experienced the largest year-over-year deviations in CDDs for the week, with increases of 73.8 percent and 72.5 percent, respectively, compared to last year. Relative to the 30-year normal, the East North Central and East South Central regions recorded the highest positive deviations among warmer-than-normal areas of 25.9 percent and 24.2 percent, respectively. In contrast, the Pacific region showed the greatest overall deviation from the 30-year norm, with CDDs 30.4 percent below normal, indicating cooler conditions.
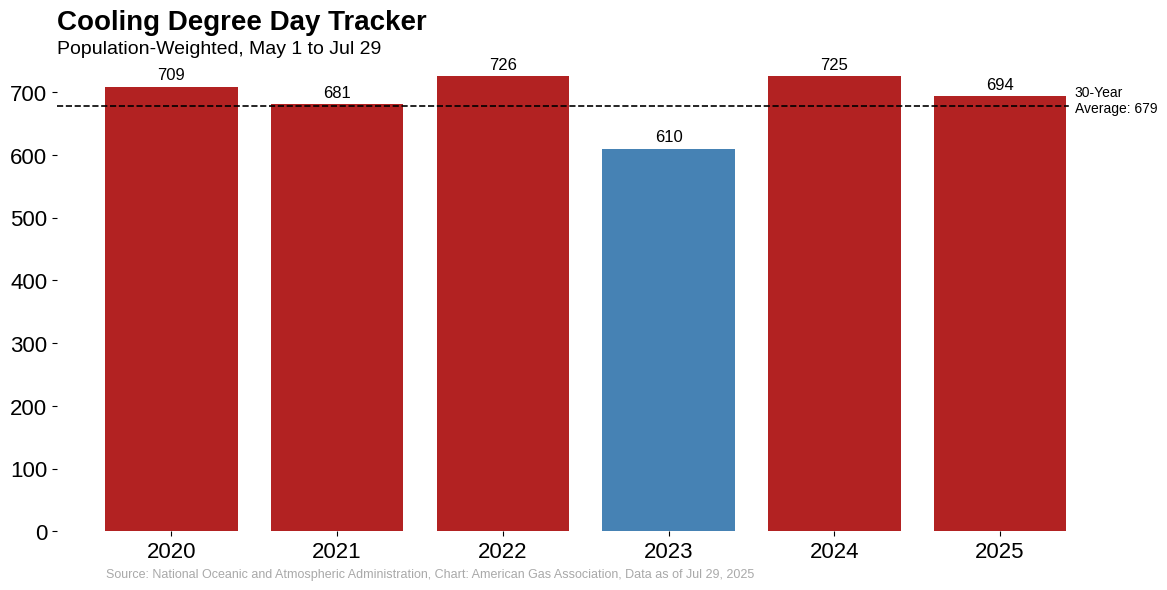
From the start of the cooling season to date, cumulative CDDs sit 15 degrees days above the 30-year average as of July 29. Relative to the same period last year, total CDDs are down 4.3 percent from 725 cumulative degree days.

Above-normal temperatures are expected for much of the U.S. into early August. National Oceanic and Atmospheric Administration (NOAA) projections show at least a 50 percent probability of above-normal temperatures across much of the South, Midwest, and Northeast and portions of the West Coast. In the Eastern and Central Pacific, NOAA’s National Hurricane Center (NHC) is tracking Tropical Storms Iona and Gil. As of the evening of July 30, the NHC reported that Iona, formerly a Category 3 hurricane, is moving west beyond Hawaii with little change in strength, while Gil is moving west after forming South-Southwest of the Southern Baja California peninsula. There are currently no coastal watches or warnings in effect for either system.
Demand Growing on Hotter Weather
According to preliminary data from S&P Global, domestic natural gas consumption for the week ending July 31 increased 5.9 percent week-over-week. Compared to the same week last year, domestic consumption is up 1.4 percent. On a weekly basis, natural gas demand in the residential and commercial sector increased 4.4 percent, while industrial demand remained flat for the week. Year to date, residential and commercial sector demand increased 12.5 percent compared to the same period last year, while industrial demand is up 1.8 percent. With respect to the electric power sector, natural gas demand for the week ending July 28 has risen 4.6 percent week-over-week, averaging nearly 49 Bcf per day, according to Rystad Energy. Year to date, electric power consumption lags prior year by nearly 3 percent.
Regionally for the week ending July 31, preliminary S&P data indicates:
- Industrial sector demand was highest in the Mountain region, increasing 7.7 percent year-over-year.
- Residential and commercial sector demand rose by nearly 10 percent week-over-week in the Northeast but fell 0.7 percent in the Western region.
- Year-over-year, residential and commercial sector demand is up in all regions, within a range of 6.4 percent in the Western region and 26.1 percent in the Northeast.
Year-to-Date Production Gains
Despite a 0.3 percent week-over-week increase, natural gas production for the week ending July 31 is up 3.1 percent compared to year-ago levels, according to preliminary data from S&P Global. Year-to-date, production levels are 3.6 percent higher than the same period last year.
Compared to the week ending July 31, 2024:
- Midcontinent and Texas production fell by 0.4 percent and 0.8 percent, respectively.
- Four regions posted year-over-year production gains within a range of 0.5 percent in the Southeast and 1.2 percent in the Rocky Mountain and Western regions.
Feedgas Deliveries Remain Strong Year-over-Year
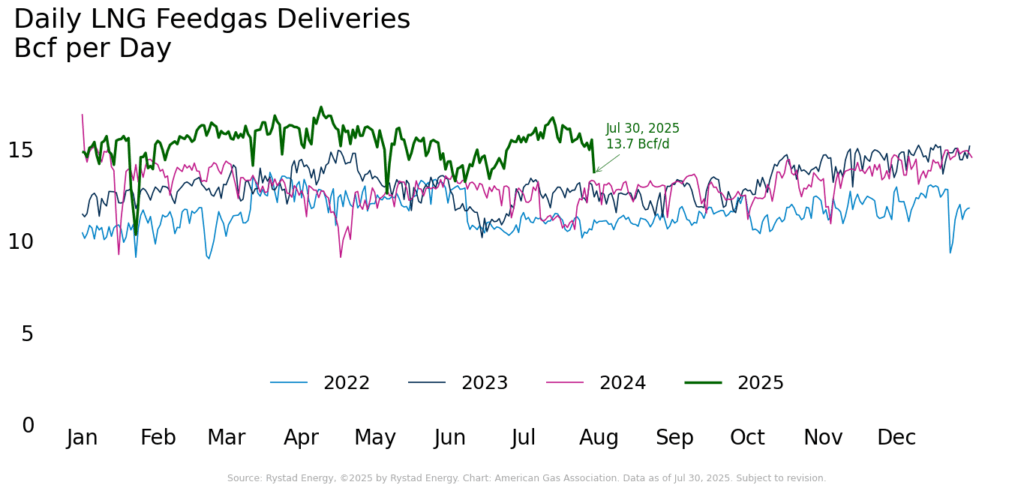
For the week ending July 23, 28 vessels with a combined carrying capacity of 104 Bcf departed the U.S., according to Bloomberg Finance L.P. data cited by the EIA. The number of vessels increased by one compared to last week, with the combined carrying capacity remaining steady. While feedgas deliveries are down 4.8 percent week-over-week for the week ending July 30, flows remain strong compared to last year, growing 32.7 percent, according to Rystad Energy. For the year to date as of July 30, feedgas flows are 19.1 percent higher than last year’s levels.

Pipeline Activity Mixed
For the week ending July 31, natural gas imports from Canada fell 0.1 percent week-over-week and 9 percent year-over-year, according to preliminary data from S&P Global. By comparison, exports to Mexico are up 4.8 percent week-over-week but down 4 percent compared to year-ago levels.
Natural Gas Rig Activity Increases
For the week ending July 25, the number of active rigs in the U.S. declined by two to 542 compared to the prior week and 47 compared to the same week last year. The gas rig count increased by five to 122 for the week, up 21 rigs or nearly 21 percent year-over-year. These gains were offset by a reduction of seven oil-directed rigs week-over-week and 67 year-over-year, bringing the oil rig count to 415.
Storage Inventories Reach 3.1 Tcf
The EIA reported a net storage injection of 48 Bcf for the week ending July 25, bringing total underground inventories to 3,123 Bcf. Storage levels in the lower 48 are now 6.7 percent above the five-year average, though they remain 3.8 percent below year-ago levels. All regions are currently reporting inventories above their five-year averages, ranging from 1.1 percent in the East to 25.3 percent in the Mountain region. In contrast, year-over-year comparisons are more mixed: only the Pacific and South Central regions are reporting gains over 2024 levels of 5.6 percent and 0.3 percent, respectively.
What to Watch:
- Prices: Henry Hub futures showed little reaction to the summer heat as the August prompt month expired—even as scorching heat pushed cooling demand higher. Will fundamentals like robust storage and steady production keep September pricing contained, or could weather or macro shifts jolt the curve?
- Demand: Despite strong week-over-week gains, electric power demand for natural gas year-to-date is trailing year-ago levels. Will the extended early-August heatwave have a meaningful effect on these trends?
- Cooling Degree Days: To date, CDDs for the cooling season lag 2024 levels. Could late summer heat close the gap as August unfolds?
For questions please contact Juan Alvarado | jalvarado@aga.org, Liz Pardue | lpardue@aga.org, or
Lauren Scott | lscott@aga.org
To be added to the distribution list for this report, please notify Lucy Castaneda-Land | lcastaneda-land@aga.org
NOTICE
In issuing and making this publication available, AGA is not undertaking to render professional or other services for or on behalf of any person or entity. Nor is AGA undertaking to perform any duty owed by any person or entity to someone else. Anyone using this document should rely on his or her own independent judgment or, as appropriate, seek the advice of a competent professional in determining the exercise of reasonable care in any given circumstances. The statements in this publication are for general information and represent an unaudited compilation of statistical information that could contain coding or processing errors. AGA makes no warranties, express or implied, nor representations about the accuracy of the information in the publication or its appropriateness for any given purpose or situation. This publication shall not be construed as including advice, guidance, or recommendations to take, or not to take, any actions or decisions regarding any matter, including, without limitation, relating to investments or the purchase or sale of any securities, shares or other assets of any kind. Should you take any such action or decision; you do so at your own risk. Information on the topics covered by this publication may be available from other sources, which the user may wish to consult for additional views or information not covered by this publication.
Copyright © 2025 American Gas Association. All rights reserved.Natural Gas Market Indicators – June 6, 2025