Natural Gas Market Indicators – June 20, 2025
Natural Gas Market Summary
Summer has officially arrived, bringing with it the potential for above-normal temperatures across large areas of the country through the end of June. Domestic natural gas consumption remains steady while both production and LNG feedgas deliveries lag recent record high levels. However, these trends may prove temporary. The Energy Information Administration’s (EIA) June 2025 Short-Term Energy Outlook (STEO) projects that June electric power consumption could be 25.7 percent higher than May, with production expected to rise 0.4 percent month over month.
For the month to date as of June 16, Henry Hub spot prices have averaged $2.84 per MMBtu, nearly 9 percent lower than the May 2025 average spot price, according to EIA data. The EIA lowered its 2025 spot price estimate by 2.4 percent to $4.02 per MMBtu in its June STEO. In contrast, Henry Hub futures prices averaged $3.64 per MMBtu over the same period, 5.3 percent higher than the May 2025 average. New capacity developments continue to bolster the outlook for gas-driven generation amid growing electricity demand. S&P Global Commodity Insights (S&P Global) reports that Duke Energy has proposed a 1.4 GW natural gas power plant in South Carolina. If approved, the project is expected to begin commercial operations in 2031. In Ohio, regulators have approved a 200 MW natural gas power plant intended to provide dedicated power to a Meta data center. Commercial operations are expected to begin in late 2026.
Futures Prices Rise on Weather, Geopolitical Influences
According to CME, the Henry Hub prompt month settled at $3.99 per MMBtu on June 18, up 13.7 percent week-over-week and 13.3 percent above July prompt-month contract rollover date. This marks the highest prompt-month futures price for Henry Hub since early April, with prices floating above $4 per MMBtu during early trading on Friday as temperature forecasts turn notably warmer and the conflict between Iran and Israel escalates, according to NGI. The 12-month strip gained $0.31 per MMBtu week-over-week as of June 18, up 5.6 percent since the first trading day of June.
Henry Hub spot prices reached a month-to-date high of $3.13 per MMBtu on June 9, according to the EIA, up approximately 20 percent year-over-year but in line with the May 2025 average spot price. For the quarter-to-date, the average Henry Hub spot price is $3.18 per MMBtu.
Argus reports the following regional natural gas spot prices as of June 18:
- The Rockies and Northwest had the lowest regional price of $2.51 per MMBtu.
- The highest regional price occurred in Louisiana and the Southeast at$3.60 per MMBtu.
- Reported prices in other regions ranged from $2.76 per MMBtu in the Southwest to $3.43 per MMBtu in the Northeast.
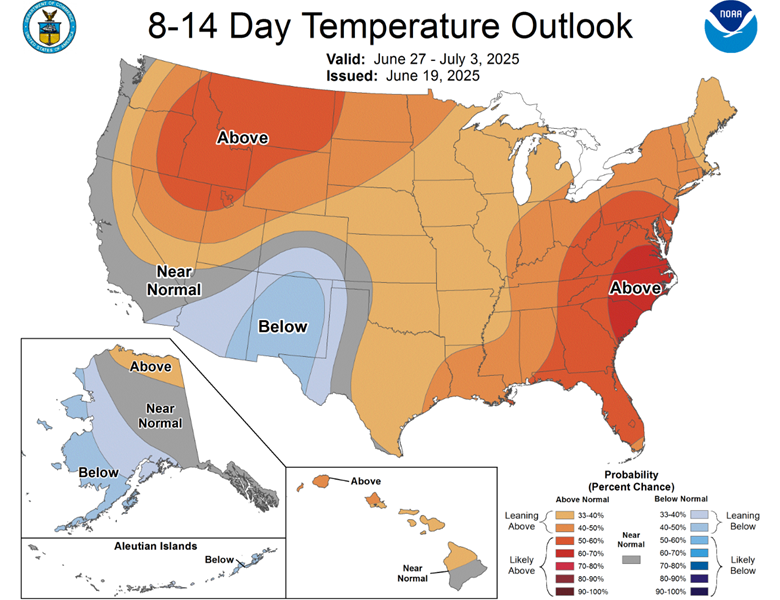
Warmer Temperatures and Tropical Storm Erick on the Horizon
The National Oceanic and Atmospheric Administration’s (NOAA) temperature forecast suggests most of the U.S. could experience above-normal temperatures into early July. Coastal areas of the Carolinas and Virginia have the highest likelihood (between 70 and 80 percent) of above normal temperatures during this time. In contrast, the Pacific Coast and a portion of the Southwest may experience below- or near-normal temperatures into late June.
For the week ending June 14, there were 49 cooling degree days (CDDs), compared to the 30-year normal of 45. Weather for the week was 8.9 percent warmer than last year and 8.9 percent warmer than the 30-year normal. Regionally, all areas were warmer than the 30-year normal with the exception of New England, Middle Atlantic, East North Central, and West North Central, and all regions except the West South Central, West North Central, and Mountain regions were warmer than last year.
In the Eastern Pacific, Hurricane Erick made landfall on the southern coast of Mexico on Thursday as a Category 3 storm, causing heavy rain and at least one death. Reuters reports this is the earliest major hurricane to make landfall in the Eastern Pacific.
Annual Domestic Gas Consumption Up Slightly
Total U.S. natural gas demand, including exports, rose 0.6 percent week-over-week and 1.7 percent year-over-year for the week ending June 20, according to preliminary data from S&P Global. Domestic consumption rose 1.1 percent week-over-week, driven by a 4.9 percent increase in the electric power sector. By comparison, residential and commercial sector consumption fell 10.5 percent week-over-week and industrial sector consumption softened 0.7 percent . Year-over-year, domestic consumption rose 0.5 percent.
Regional consumption trends for the week are mixed:
- All regions except the Midwest, Rockies, and Texas experienced week-over-week increases ranging from 0.9 percent to 6.3 percent.
- Year-over-year, four regions experienced consumption declines, with the largest decrease of 8.5 percent occurring in the Midcontinent.
- The Midwest, Northwest, Southwest, and Texas posted year-over-year increases within a range of 2.5 percent to 11 percent.
Steady U.S. Dry Gas Production Trends Amid Strong Northeast Output
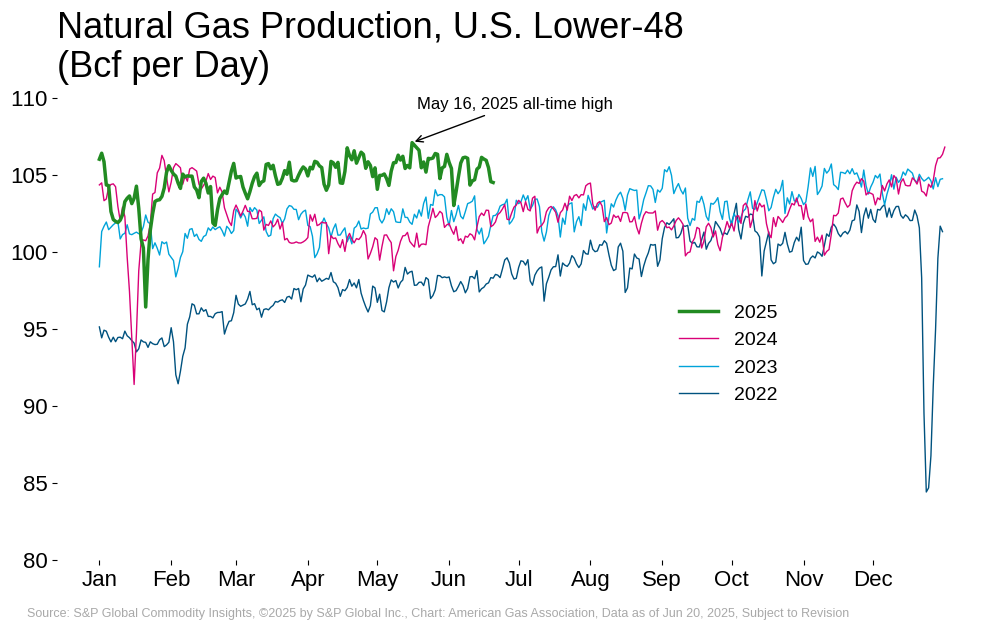
Preliminary data from S&P Global suggests U.S. dry gas production increased 0.1 percent week-over-week and 3.2 percent year-over-year for the week ending June 20. Despite softening production since a new record high was set on May 16, 2025, year-to-date natural gas production through June 20 remains 2.7 percent higher than over the comparable period in 2024.
Regionally for the week ending June 20:
- Production in the Northeast, Midcontinent, Rockies, and Texas rose between 0.1 percent and 1.4 percent week-over-week while production in the Southeast, Southwest, and Midwest fell between 0.4 percent and 2.1 percent.
- The Midwest and Southwest posted year-over-year production declines of 7.1 percent and 6.1 percent, respectively.
- All other regions posted year-over-year production gains, with the largest increase of 7.5 percent occurring in the Northeast.
Exports to Mexico Fall Week-over-Week
Natural gas imports from Canada rose 1.3 percent week-over-week as of June 20, according to preliminary data from S&P Global. Compared to the same period last year, Canadian imports are down 0.8 percent. By comparison, exports to Mexico fell 3.4 percent week-over-week and 1.2 percent year-over-year.
Weekly Feedgas Deliveries Down Slightly
Between June 5 and June 11, 28 LNG vessels departed the U.S. with a combined carrying capacity of 105 Bcf, according to Bloomberg Finance L.P. data cited by the EIA. This represents a week-over-week increase of three vessels and 11 Bcf of LNG exports.
U.S. LNG feedgas deliveries fell slightly for the week ending June 20, with average daily volumes down 0.2 percent week-over-week, according to preliminary data from S&P Global. On an annual basis, feedgas deliveries are more than 11 percent higher year-over-year. The daily volume as of June 20 is approximately 17 percent below the daily record set in April, due in large part to routine maintenance at key facilities.
Regionally for the week:
- Southeast feedgas volumes are 0.2 percent higher week-over-week and 15.7 percent higher year-over-year, driven by increasing throughput at key terminals including Elba Island and Plaquemines.
- Week-over-week deliveries in Texas are down 0.5 percent but remain 3.1 percent higher than over the same period last year.
- In the Northeast, feedgas deliveries for the week are down 1.7 percent compared to the week prior but are 9.4 percent higher than in the same period last year.
Rig Count Continues to Decline
According to Baker Hughes, the number of U.S. gas rigs decreased by one to 113 rigs between June 6 and June 13. Compared to the same week last year, the number of gas rigs is up by more than 15 percent. Total U.S. oil and gas rigs decreased by four to 555 rigs for the week and are 35 rigs or 5.9 percent lower than year-ago levels. According to Reuters, the current total U.S. rig count is the lowest since November 2021.
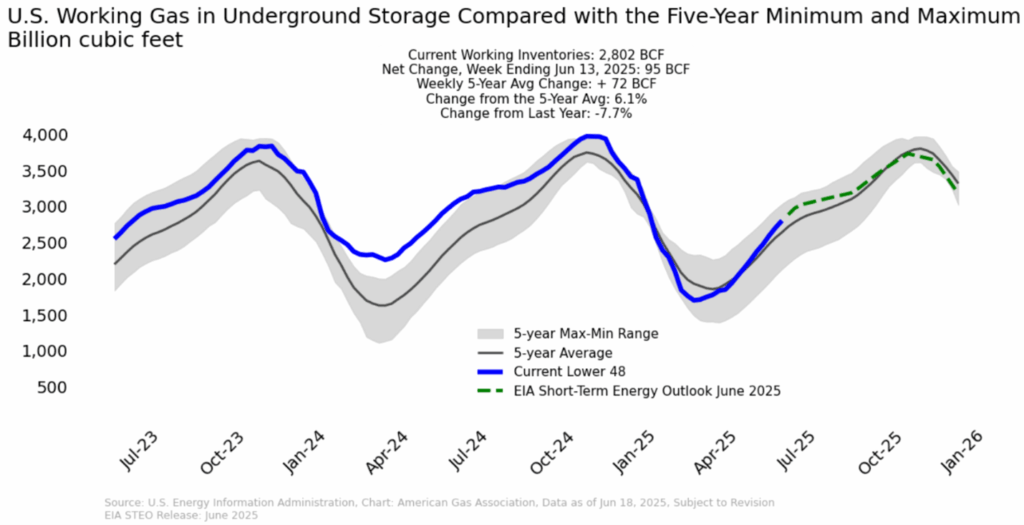
Inventories Rising but Remain Below 2024 Levels
For the week ending June 13, U.S. underground storage inventories stood at 2,802 Bcf, following a 95 Bcf net injection for the week. Inventories are 7.7 percent below last year’s levels, but 6.1 percent above the five-year average. Underground natural gas storage inventories have increased 58 percent since the week ending March 28, when levels were 4.3 percent below the five-year average, highlighting healthy refill activity despite tighter year-over-year comparisons.
Regionally, storage levels lag last year in all regions, with the Midwest showing the largest year-over-year deficit at 13 percent. The Pacific region posted the narrowest deficit, down just 1.8 percent year-over-year. Conversely, storage inventories in all regions are above the respective regional five-year averages, with the Mountain region holding the largest surplus at 30.1 percent.
What to Watch:
- Demand: Temperatures are expected to be above normal in much of the U.S. into early July. With weather in many regions already warmer than last year, could the U.S. experience a material increase in natural gas consumption this summer?
- Prices: As heat-driven demand rises and global supply risks emerge, what will be the impact on natural gas futures in the near term?
- LNG Exports: If the conflict in the Middle East reduces LNG supply to Europe and Asia, could U.S. LNG exports fill the gap?
For questions please contact Juan Alvarado | jalvarado@aga.org, Liz Pardue | lpardue@aga.org, or
Lauren Scott | lscott@aga.org
To be added to the distribution list for this report, please notify Lucy Castaneda-Land | lcastaneda-land@aga.org
NOTICE
In issuing and making this publication available, AGA is not undertaking to render professional or other services for or on behalf of any person or entity. Nor is AGA undertaking to perform any duty owed by any person or entity to someone else. Anyone using this document should rely on his or her own independent judgment or, as appropriate, seek the advice of a competent professional in determining the exercise of reasonable care in any given circumstances. The statements in this publication are for general information and represent an unaudited compilation of statistical information that could contain coding or processing errors. AGA makes no warranties, express or implied, nor representations about the accuracy of the information in the publication or its appropriateness for any given purpose or situation. This publication shall not be construed as including advice, guidance, or recommendations to take, or not to take, any actions or decisions regarding any matter, including, without limitation, relating to investments or the purchase or sale of any securities, shares or other assets of any kind. Should you take any such action or decision; you do so at your own risk. Information on the topics covered by this publication may be available from other sources, which the user may wish to consult for additional views or information not covered by this publication.
Copyright © 2025 American Gas Association. All rights reserved.Natural Gas Market Indicators – June 6, 2025