Natural Gas Market Indicators – June 6, 2025
Natural Gas Market Summary
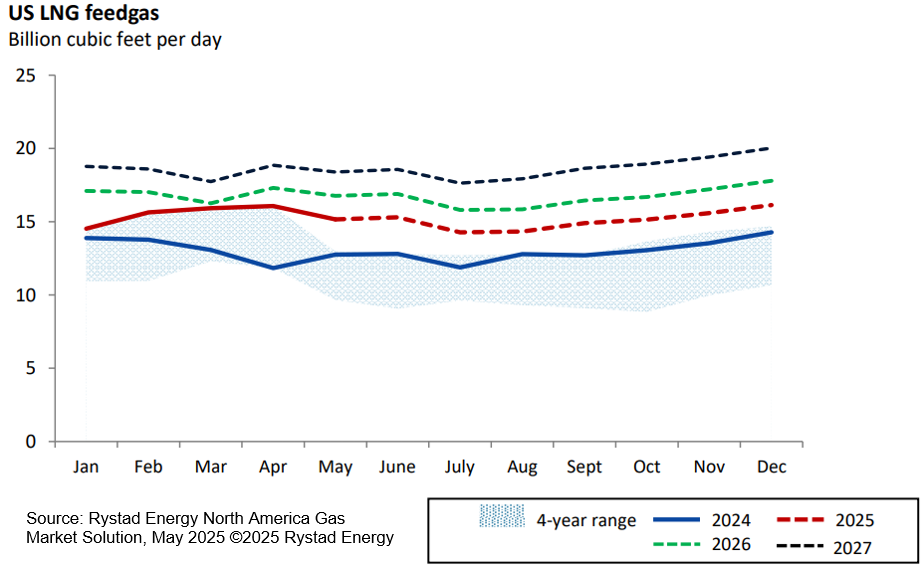
As summer approaches, natural gas production remains near record levels while domestic demand lags. Domestic production reached a new monthly record in May, reaching 106.6 Bcf per day on average, according to data from Rystad Energy. Domestic demand has remained soft due to milder spring temperatures, but that trend could be changing with above-normal temperatures expected into mid-June. Despite reaching a new monthly record in April, average monthly LNG feedgas deliveries fell 7 percent in May to 14.9 Bcf per day, according to Rystad Energy. Underground storage injections have been building at the fastest pace since at least 2010, leading to quickly refilling inventories.
Average May 2025 Henry Hub prompt-month prices were 1 percent higher than in April and more than 43 percent higher than the same period last year. Into early June, prices rose to $3.72 per MMBtu on June 3 according to CME data, a 9.5 percent increase over the prior week. On the same day, the 12-month strip increased 1.5 percent week-over-week to $4.18 per MMBtu. Nevertheless, operational disruptions have clouded the export outlook in the near term. Gas deliveries to Freeport LNG fell following a May 23rd power outage. Coupled with routine maintenance at other facilities—including Sabine Pass, the largest in the U.S.—feedgas levels have remained subdued into early June. Despite the spring stall, Rystad Energy expects feedgas delivery growth to resume in the second half of 2025.
Higher Prompt Month, Lower Strip as June Begins
July 2025 prompt-month pricing for Henry Hub futures settled at $3.52 per MMBtu on May 29, up nearly 10 percent from the roll date and 1.2 percent higher than the first trading day of May 2025. Since then, July 2025 contracts have remained bullish, rising an additional 5.5 percent and ultimately settling at $3.72 per MMBtu on June 4. The 12-month strip settled 5.6 percent higher week-over-week on June 4, with the spread between the 12-month strip and the daily prompt month settlement narrowing by more than a third compared to the previous week. Henry Hub spot prices settled at $3.00 per MMBtu on June 2, down 6.3 percent relative to May 27 and nearly 4 percent lower than the May 2025 spot price average.
According to Argus Media, of regional transactions on June 4 in the U.S.:
- The highest average spot price of $2.84 per MMBtu was noted in the Northeast.
- The lowest average spot price of $2.02 per MMBtu was noted in the Appalachian region.
- Other regional spot prices ranged from $2.28 per MMBtu to $2.78 per MMBtu.
Hurricane Season Begins
The Atlantic hurricane season has arrived, and with it, predictions for storm activity this year. The National Oceanic and Atmospheric Administration (NOAA) anticipates above-normal hurricane activity during the 2025 season, predicting a 60 percent chance of an above-normal season, a 30 percent chance of a near-normal season, and a 10 percent chance of a below-normal season. By comparison, Dr. Ryan Maue at Weather Trader anticipates that between June 1 and November 30, there will be 14 named storms, seven hurricanes, and three major hurricanes. The Colorado State University hurricane activity forecast predicts a very active hurricane season comprised of 17 named storms (the 1991 through 2020 average was 14.4) of great intensity. CSU predicts the accumulated cyclone energy (a measure of the season’s potential for wind and storm damage) over hurricane season will be 155, higher than the 1991-2020 average of 123. There are currently no active storms in the Pacific or Atlantic.
For the week ending May 31, cooling degree days (CDDs) in the U.S. totaled 25, which is 32.4 percent cooler than last year and 21.9 percent cooler than the 30-year normal. Regionally, all parts of the country were cooler than last year except the Mountain and Pacific regions. In addition, the South Atlantic, East South Central, West South Central, and Mountain regions were the only areas to experience warmer-than-normal weather. In the Pacific region, CDDs remained flat relative to the 30-year normal.
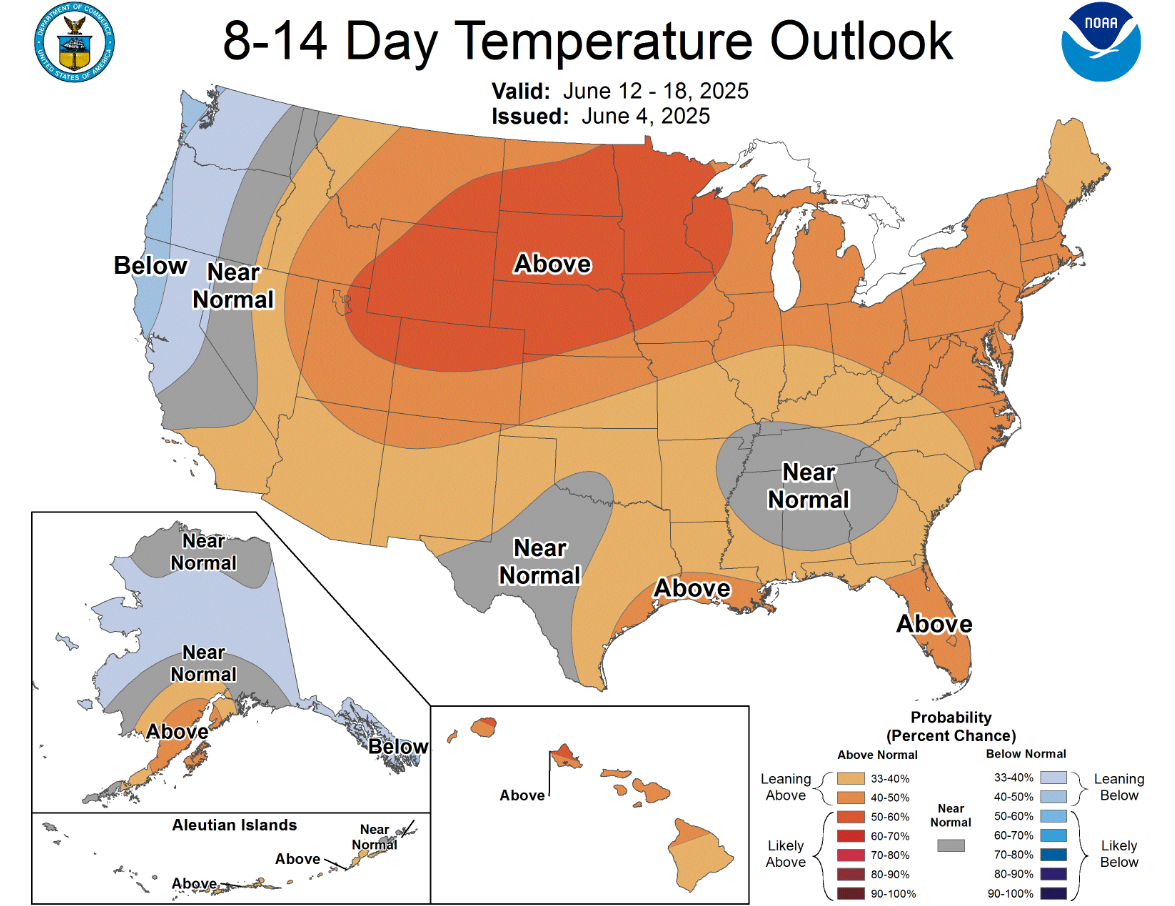
As June unfolds, NOAA’s 8-to-14-day temperature outlook anticipates that most of the U.S. will experience near- or above-normal temperatures, while parts of the West Coast and Alaska are predicted to be below-normal. Much of the northern Midwest is estimated to have between a 50 percent and 60 percent chance of above-normal conditions through June 18.
Demand Up Year-Over-Year as First Day of Summer Nears
Total U.S. natural gas demand, including exports, fell nearly 1 percent week-over-week but increased 1.6 percent year-over-year for the week ending June 5, according to preliminary data from S&P Global. By comparison, domestic consumption increased nearly 1 percent relative to the week prior and 1.3 percent year-over-year. On a week-over-week basis, consumption in the electric power sector increased 9 percent while residential and commercial consumption fell nearly 17 percent. Year-over-year, residential and commercial sector consumption posted gains of 13.6 percent while the electric power sector fell 1.3 percent.
Regionally for the week:
- Consumption in all sectors but the Midwest and Rockies increased relative to last week within a range of 1 percent to 9.6 percent.
- The largest year-over-year decrease occurred in the Midwest, where consumption fell 11.2 percent week-over-week.
- On an annual basis, five regions experienced increased consumption trends, with the largest gain of 21.1 percent posted in the Northwest. By comparison, consumption fell in three regions, with the Midwest experiencing the largest decline of 3 percent.
Northeast Production Records Continue
For the week ending June 5, preliminary data from S&P Global indicates domestic natural gas production softened nearly 1 percent week-over-week but exceeded prior year levels by 3.5 percent. Northeast natural gas production reached a new daily record on May 23, and both domestic and Northeast production set new monthly records in May.
Regionally, only the Midwest posted a week-over-week production gain of 0.1 percent, while other regions posted declines. Production in the Midcontinent remained flat for the week. The largest week-over-week decline of 6.7 percent occurred in the Southwest.
For the week ending June 5:
- All but two regions posted production increases, with the largest gains noted in the Southeast and Northeast, where production grew 8.6 percent and 8.5 percent year-over-year, respectively.
- Other gains for the week ranged from 0.9 percent in Texas to 2.4 percent in the Rockies.
- Production declined in the Midwest and Southwest by 8.8 percent and 8.3 percent, respectively.
LNG Demand Lags Recent Record
A total of 29 vessels with a combined carrying capacity of 109 Bcf departed the U.S. during the week ending May 28, according to the Energy Information Administration (EIA). Of those, eight departed from the Sabine Pass, five from Corpus Christi, and four from Freeport. Remaining vessels departed from Cameron, Calcasieu Pass, Plaquemines, Cove Point, and Elba Island. Compared to the previous week, total vessels increased by two and total carrying capacity increased by 6 Bcf.
As of June 5, feedgas deliveries on a weekly average basis are 9 percent lower than the previous week but 3.1 percent higher than year-ago levels, according to preliminary data from S&P Global. Daily LNG feedgas volumes have declined 21.5 percent since the record high set on April 9. This is due in part to routine facility maintenance, including at the Sabine Pass facility in Texas, and lower flows to Freeport LNG following a late-May power outage, according to Reuters.
Progress was also made recently on two proposed LNG facilities. In late April, Woodside Energy reached final investment decision (FID) for a three-train liquefaction facility in Louisiana with a targeted in-service date in 2029. On May 30, Venture Global received permission from the Federal Energy Regulatory Commission (FERC) to proceed with construction of the CP2 LNG facility in Louisiana.
Underground Storage Reserves Continue to Improve
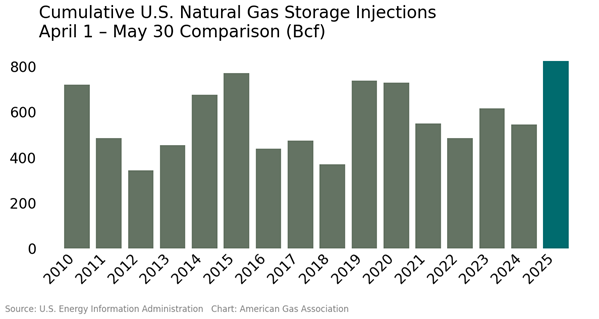
Natural gas inventories have been refilling at the fastest pace since at least 2010, with cumulative injections of 825 Bcf since March 28. According to the EIA, working gas inventory in underground storage increased by 122 Bcf for the week ending May 30, bringing total inventories to nearly 2,600 Bcf. Inventories are now 4.7 percent higher than the five-year average but continue to lag year-ago levels by 10 percent.
Regionally, underground storage inventories in all regions are above the five-year average within a range of 0.5 percent in the Midwest to nearly 35 percent in the Mountain region. However, inventory in all regions continues to lag prior-year levels. For the week ending May 30, the largest year-over-year deficit of 15.4 percent occurred in the Midwest. The Pacific posted the smallest deficit of 4 percent.
Exports to Mexico Soar in 2025
Natural gas exports to Mexico could be on track to reach new records this year. Through May 2025, monthly average exports have exceeded year-ago averages for each month. For the year-to-date as of June 5, average daily exports are 5.5 percent higher year-over-year, according to preliminary data from S&P Global. Average daily exports to Mexico nearly set a new record on May 20, falling short of the April 22 record by 0.4 percent.
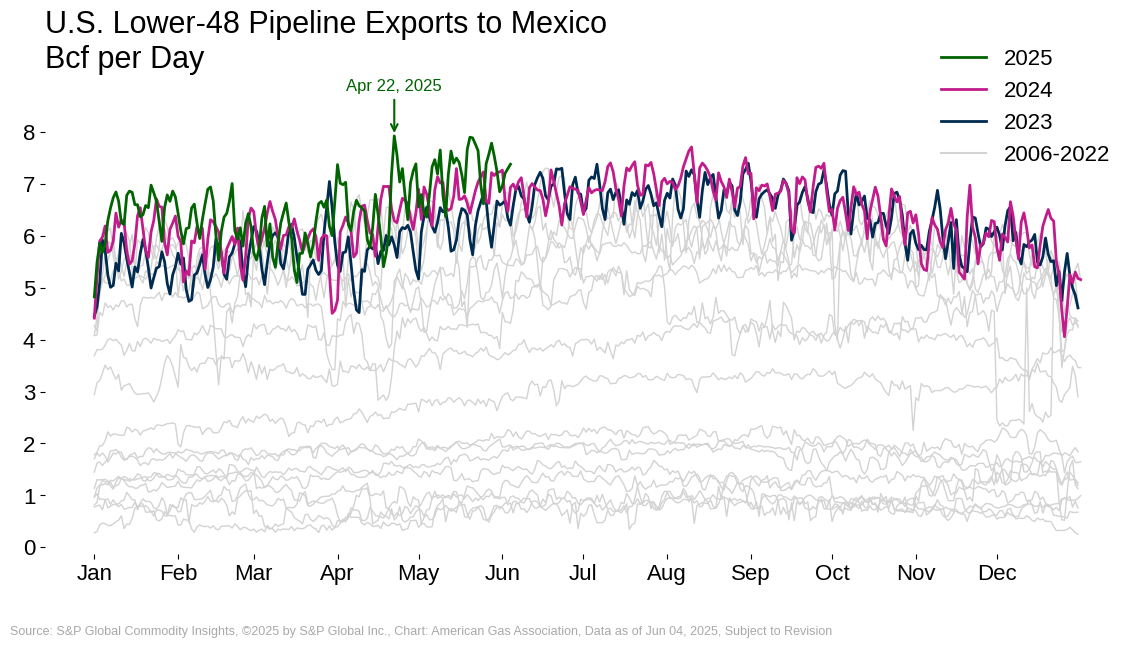
For the week ending June 5, average daily natural gas imports from Canada and exports to Mexico declined relative to the previous week, falling by 2.9 percent and 2.3 percent, respectively. Compared to the same week last year, Canadian imports are up by 19.8 percent and exports to Mexico increased 3.8 percent.
Natural Gas Rig Activity Effectively Flat
Baker Hughes reports that the number of U.S. natural gas rigs totaled 99 for the week ending May 30, up by one rig week-over-week and down by one rig compared to the same week last year. Total U.S. rig count stands at 563, down 37 rigs, or 6.2 percent, relative to the same period last year. The total count includes 461 oil rigs and three miscellaneous rigs. Rystad Energy recently lowered its short- and medium-term upstream spending outlook due to the continued impact of geopolitical and macroeconomic uncertainties on upstream oil and gas markets, including continued pressure on oil prices. For the week ending May 30, the U.S. horizontal oil rig count fell to 431, the lowest level in three years.
What to Watch:
- LNG Feedgas: Will feedgas deliveries rebound to April levels once routine maintenance is complete?
- Pipeline Exports: Will record-setting natural gas exports to Mexico continue in the near term?
- Storage: With underground inventories lagging year-ago levels and above-normal temperatures on the horizon, how might refill season progress be affected?
For questions please contact Juan Alvarado | jalvarado@aga.org, Liz Pardue | lpardue@aga.org, or
Lauren Scott | lscott@aga.org
To be added to the distribution list for this report, please notify Lucy Castaneda-Land | lcastaneda-land@aga.org
NOTICE
In issuing and making this publication available, AGA is not undertaking to render professional or other services for or on behalf of any person or entity. Nor is AGA undertaking to perform any duty owed by any person or entity to someone else. Anyone using this document should rely on his or her own independent judgment or, as appropriate, seek the advice of a competent professional in determining the exercise of reasonable care in any given circumstances. The statements in this publication are for general information and represent an unaudited compilation of statistical information that could contain coding or processing errors. AGA makes no warranties, express or implied, nor representations about the accuracy of the information in the publication or its appropriateness for any given purpose or situation. This publication shall not be construed as including advice, guidance, or recommendations to take, or not to take, any actions or decisions regarding any matter, including, without limitation, relating to investments or the purchase or sale of any securities, shares or other assets of any kind. Should you take any such action or decision; you do so at your own risk. Information on the topics covered by this publication may be available from other sources, which the user may wish to consult for additional views or information not covered by this publication.
Copyright © 2025 American Gas Association. All rights reserved.