Natural Gas Market Indicators – March 5, 2026
Natural Gas Market Summary
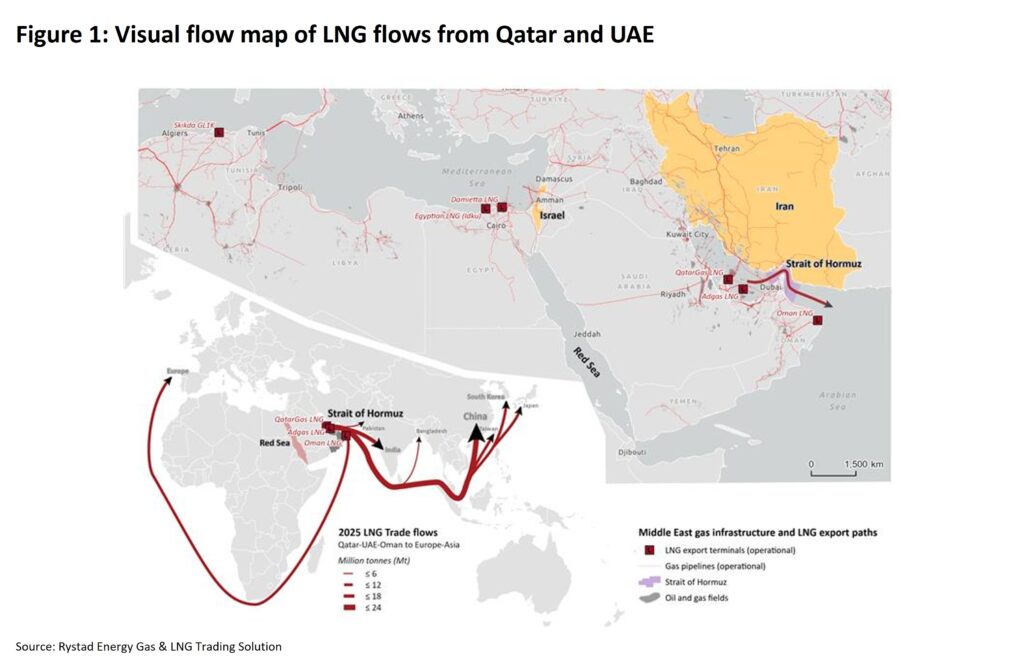
Following late-January price spikes tied to severe cold, Henry Hub prices retreated toward the low-$3 per MMBtu range, easing pressure on residential and commercial consumers while supporting competitive positioning in the power sector. At the same time, reduced traffic through the Strait of Hormuz and the shutdown of QatarEnergy LNG export have injected new uncertainty into global LNG markets, reinforcing the U.S. as a critical marginal supplier to both Europe and Asia.
Domestically, production has rebounded from storm-related freeze-offs and continues to trend above year-ago levels, with incremental growth expected through the end of the year. Demand remains supported by strong LNG feedgas flows and coal-to-gas switching in the power sector, according to Rystad Energy, even as warmer weather begins to ease seasonal consumption. Forward prices moved slightly higher in early March, but supply remains ample relative to demand.
Prices Edge Higher in Early March
After reaching a record high in late January, the Henry Hub prompt month settled at $2.83 per MMBtu, the first day of the April front month contract and the lowest price yet for the current winter heating season. Futures prices rose above $3 in early March, which Rystad Energy observed could reflect a mix of geopolitical risk sentiment and incremental LNG feedgas demand, though the underlying fundamentals suggest limited room for a sustained price shift. Looking ahead, the 12-month strip rose about 3 percent from February 27 to March 4, indicating modestly firmer expectations over the next year without materially altering the broader outlook for market fundamentals at this time.
Winter is Waning Across the U.S.
Winter continues to loosen its grip as the U.S. heating season nears its end. For the week ending February 28, the weather in the U.S. was 15.1 percent colder than last year and 7.2 percent warmer than the 30-year normal, according to population-weighted heating degree days. Compared to the 30-year normal, all regions except New England, the South Atlantic, and the East South-Central experienced warmer-than-normal temperatures, with the Middle Atlantic experiencing no change. Compared with the same week last year, all regions except the West South Central, Mountain, and Pacific regions experienced colder temperatures.
In the near term, the National Oceanic and Atmospheric Administration is forecasting warmer-than-normal temperatures across much of the U.S. through March 13, with near-normal or below-normal conditions most likely in parts of the Upper Midwest, Mountain region, and Alaska. The probability of warmer-than-normal conditions exceeds 80 percent in parts of the Northeast, South Atlantic, East North Central, and East South Central regions, with probabilities above 90 percent along the Atlantic Coast in the Carolinas and Georgia.
Coal-to-Gas Switching Supports Heightened Electric Power Demand
Total natural gas demand, including exports, remains supported by strong global demand for U.S. LNG. Preliminary S&P Global Energy data indicate total demand is up 2.4 percent year-over-year for the week ending March 5. Domestic consumption fell 1.3 percent below year-ago levels, driven by a 12.5 percent reduction in residential and commercial sector demand and a 1.8 percent decline in industrial sector demand. Gains in electric power consumption nearly offset these losses, however, rising 13.4 percent year-over-year.
Rystad Energy’s February North America Gas Market Report points to a similar dynamic on a monthly basis, with natural gas-powered generation up 0.7 percent year over year in February, supported by relatively low gas prices that have helped keep natural gas competitive with coal. Over the same period, coal-fired generation fell 4.3 percent year over year, marking only the second month of negative year-over-year growth since mid-2025.
On a week-over-week basis, domestic demand softened as cooler weather conditions eased. For the week ending March 5, preliminary data from S&P Global Energy indicate that domestic demand declined 11.8 percent, with the largest drop of 24.2 percent in the residential and commercial sectors.
Associated Gas and Gulf Coast Basins Expected to Drive Production Growth
Preliminary data from S&P Global Energy indicate that February dry natural gas production rose 1.6 percent from the January average, rebounding from weather-related impacts associated with Winter Storm Fern. Output was 4.3 percent higher than in February 2025. Rystad Energy estimates that U.S. dry natural gas production averaged 107 Bcf per day during the month. Through March 5, year-to-date production is up 2.7 percent relative to the same period last year, according to preliminary data from S&P Global Energy.
Rystad Energy projects U.S. dry natural gas production will continue expanding in 2026 despite commodity price volatility and more measured upstream capital spending. Output is expected to rise from the daily high of roughly 110 Bcf near the end of 2025 to approximately 112 Bcf per day exiting 2026, supported by associated gas growth in the Permian Basin and incremental gains in Gulf Coast basins, particularly Eagle Ford and Haynesville. While Appalachia remains resource-rich, pipeline constraints are likely to moderate near-term growth.
U.S. LNG Remains Strong Amid Tightening Global Market
The U.S. LNG market continues to reach new heights in early 2026. Feedgas flows hit a new all-time daily record of 19.6 Bcf per day on January 12, 2026, an increase of 0.7 percent over the early-December 2025 high, according to Rystad Energy. Despite brief storm-related volatility in late January, feedgas demand rebounded in February, averaging 18.8 Bcf per day, the highest monthly volume ever recorded. In March, feedgas deliveries are averaging roughly 18 Bcf per day, per Rystad Energy.
Looking ahead to spring, ongoing project activity points to further domestic growth. Cheniere announced that Corpus Christi Stage 3 Train 5 produced LNG for the first time in February 2026, marking the latest addition to U.S. liquefaction capability. In addition, Golden Pass LNG is seeking authorization from FERC to run gas through Train 1, signaling progress toward initial output, according to Argus Media.
Globally, escalating conflict in Iran has tightened global LNG fundamentals by raising supply and shipping risks. On February 28, Iran’s Islamic Revolutionary Guard Corps announced the effective closure of the Strait of Hormuz, disrupting transit routes that serve around 19 percent of global LNG supply to outside countries, according to Rystad Energy. Subsequent military actions targeting QatarEnergy’s operating facilities in Ras Laffan Industrial City and Mesaieed City forced the shutdown of all LNG production. With Qatari volumes constrained, Rystad Energy expects replacement supply to largely come from U.S. free-on-board (FOB) cargoes and West African LNG, intensifying competition between Europe and Asia for Atlantic Basin cargoes.
Compounding market tightness, Europe is entering the end of winter with unusually low inventories. Reuters reports that depleted storage levels could leave the EU vulnerable if global tightness persists, increasing competition for cargoes and adding upward pressure on prices.
Inventories Recover More Quickly than during Enzo-related Deficits in 2025
U.S. working gas stocks in underground storage declined by 132 Bcf for the week ending February 27, bringing total inventories to 1,886 Bcf, according to the EIA’s weekly natural gas storage report. Relative to year-ago levels, storage inventories are 115 Bcf higher, or 6.5 percent. Although inventories remain 2.2 percent below the five-year average, this year-over-year increase is a notable comparison: during Winter Storm Enzo in late January 2025, inventories fell below the five-year average and remained in deficit through March 7, 2025, when the shortfall reached a maximum of 11.9 percent below the five-year average. By comparison, following Winter Storm Fern, inventories have recovered more quickly, reaching a maximum deficit of 5.6 percent in the week ending February 13. With the deficit narrowing, this suggests a well-supplied market, particularly given the prolonged gas demand observed during the storm.
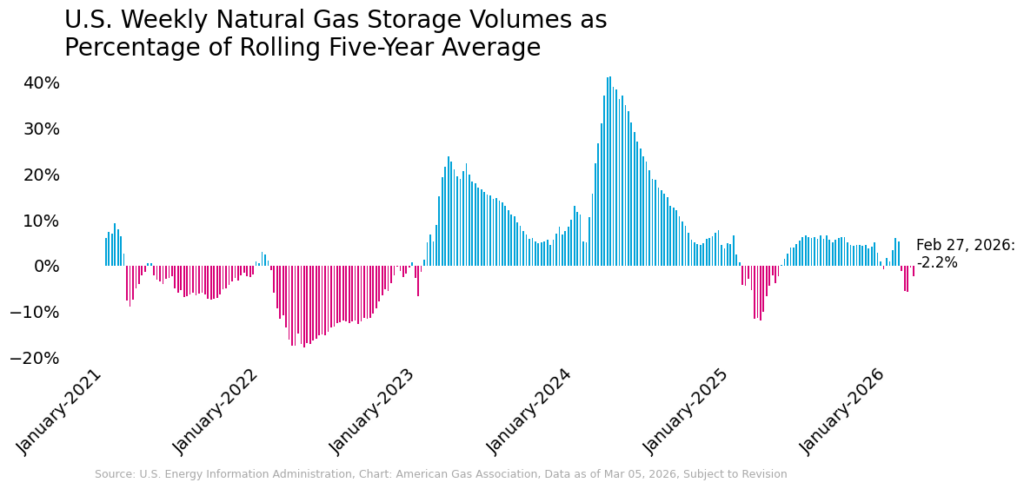
Regionally, the Pacific and Mountain regions sit above their five-year averages by 45 percent and 53.5 percent, respectively. At the same time, the East, Midwest, and South Central regions remain below their respective averages, ranging from a 6.6 percent deficit in the South Central region to a 17 percent deficit in the East.
Pipeline Capacity Increased by 6.3 Bcf per Day in 2025
Preliminary data from Rystad Energy indicate that for the week ending March 4, pipeline exports to Mexico averaged 6 Bcf per day and imports from Canada averaged 4.5 Bcf per day. Canadian imports are down 12.9 percent week-over-week and 8.2 percent year-over-year, while exports to Mexico increased by 1.8 percent and declined by 1 percent over the same periods, respectively.
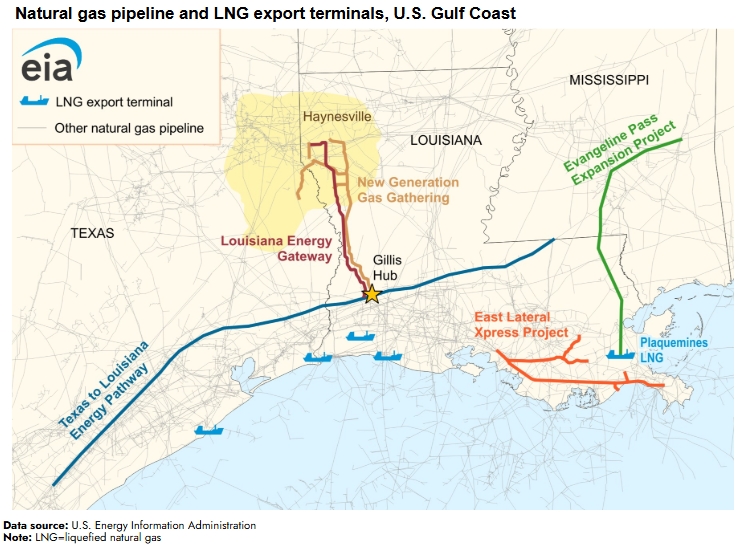
The EIA reports that in 2025, the U.S. increased its pipeline capacity by approximately 6.3 Bcf per day, with about 85 percent of additions located in the South Central region. As shown on the map below, most new additions supported upstream connectivity, particularly the Louisiana Energy Gateway and New Generation Gas Gathering projects linking Haynesville supply to the Gillis Hub, operating primarily as gathering systems that move natural gas from producers into the interstate transmission network. Several projects also targeted LNG demand growth, including two that deliver feedgas directly to Plaquemines LNG.
Gas-Directed Rigs Rise 31% from Year-Ago Levels
According to Baker Hughes, U.S. natural gas rig activity ticked modestly higher for the week ending February 27, with the gas-directed rig count increasing by one to 134 rigs, a gain of nearly 1 percent week over week. While incremental on a weekly basis, the comparison to last year tells a more notable story: natural gas rigs are up 31 percent compared to the same week last year, an increase of 32 rigs. This trend contrasts with oil-directed activity. Oil rigs declined by two from the previous week and are down 79 rigs compared to a year ago. Including miscellaneous rigs, the total U.S. rig count is 7.3 percent lower than this time last year.
The year-over-year increase in gas-directed drilling activity suggests producers are responding to higher price signals and expectations for stronger demand relative to early 2025 levels. Growth expectations tied to LNG exports, power generation demand, and emerging load from data centers and industrial activity have supported forward price signals, which in turn influence drilling decisions.
What to Watch:
- LNG: Will U.S. LNG feedgas set new records this spring amid heightened global uncertainty, or is domestic export capacity nearing its limit?
- Prices: Will global LNG market tightness meaningfully tighten U.S. balances, or will shoulder season weather keep Henry Hub prices anchored near $3?
For questions please contact Juan Alvarado | jalvarado@aga.org, Liz Pardue | lpardue@aga.org, or Lauren Scott | lscott@aga.org
To be added to the distribution list for this report, please notify Lucy Castaneda-Land | lcastaneda-land@aga.org
Notice
In issuing and making this publication available, AGA is not undertaking to render professional or other services for or on behalf of any person or entity. Nor is AGA undertaking to perform any duty owed by any person or entity to someone else. Anyone using this document should rely on his or her own independent judgment or, as appropriate, seek the advice of a competent professional in determining the exercise of reasonable care in any given circumstances. The statements in this publication are for general information and represent an unaudited compilation of statistical information that could contain coding or processing errors. AGA makes no warranties, express or implied, nor representations about the accuracy of the information in the publication or its appropriateness for any given purpose or situation. This publication shall not be construed as including advice, guidance, or recommendations to take, or not to take, any actions or decisions regarding any matter, including, without limitation, relating to investments or the purchase or sale of any securities, shares or other assets of any kind. Should you take any such action or decision; you do so at your own risk. Information on the topics covered by this publication may be available from other sources, which the user may wish to consult for additional views or information not covered by this publication.
Copyright © 2025 American Gas Association. All rights reserved.