Natural Gas Market Indicators – May 6, 2024
Natural Gas Market Summary
As of May 6, natural gas futures for June at the Henry Hub remain above $2.00 per MMBtu, and CME Group projects prices to rise above $3.00 by late 2024. The end of April and the first few days of May see a split weather pattern according to NOAA, with warmer conditions expected in the East and Midwest and cooler temperatures persisting on the West Coast. Looking ahead, entities like Colorado State University released their Atlantic Basin Hurricane season forecast with an anticipated 23 named storms and five major hurricanes. On the demand side, the EIA reports that natural gas usage for power generation has consistently increased since 2021, with a notable rise in off-peak gas generation supplanting retired coal generation. The EIA also reports a slight increase in production, as the Mountain Valley pipeline nears completion, which will enhance gas transportation from shale regions to the Mid and South Atlantic regions of the U.S. In the LNG sector, exports are poised for significant growth, supported by new projects set to increase capacity by 3.61 Bcf through 2025.
Reported Prices
As May futures expire, June futures out of Henry Hub are trading at roughly $2.43 per MMBtu as of May 6. Futures remain above $2.00 per MMBtu through October and then rise about $3.00 per MMBtu through the beginning of 2025. Since the beginning of the year, prompt-month prices have dropped by around 40 percent. While robust storage numbers and warmer weather can explain some of the reduction in prices, Reuters reports that Freeport LNG’s ongoing disruptions have had a significant effect on the market. Freeport’s total capacity stands at 2.2 Bcf per day but on certain dates, it has taken less than 70 Mcf. Freeport is expected to increase its activity in May, which may have an effect on prices as we approach the heating season. Spot prices are variable across the country, with the highest prices seen at $2.21 in Northern California.
Weather
Warmer than normal temperatures are forecasted for the East and Midwest over the next two weeks as outlined by NOAA’s 16 day forecast. NOAA’s forecast also shows that , the West Coast will likely have to deal with colder than normal temperatures through May 15.
Spring is well underway, which means that the Atlantic hurricane season looms on the horizon. Although NOAA will not release its forecast until late May, the preliminary forecast from Colorado State University predicts an “extremely active” hurricane season. CSU expects 23 named storms in the Atlantic basin (9 more than the 30 year average), and 11 hurricanes (4 more than the 30 year average). CSU also expects the accumulated cyclone energy for the season (a measure of the destructive capacity of the season’s storms) to be 70 percent higher than the 30 year average. University of Pennsylvania researchers are also expecting a very active hurricane season primarily driven by “ever-warmer conditions in the tropical Atlantic [AND] ties to large-scale warming.” They expect 33 named storms in 2024.
Demand
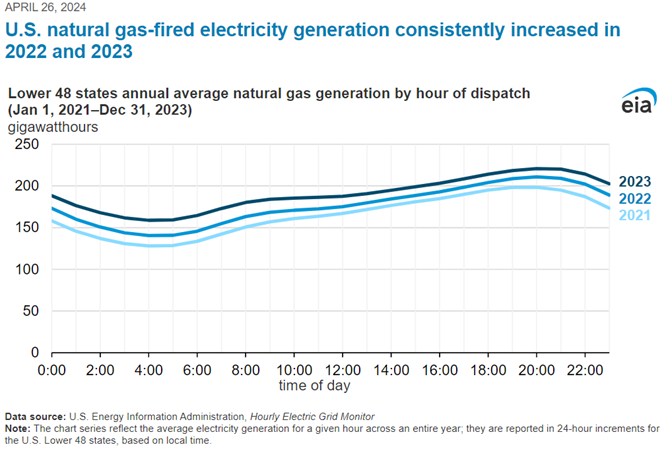
According to the Hourly and Daily Balancing Authority Operations Report collected by the EIA, natural gas used for power generation increased for all hours of the day since 2021. This means that there was an increase in the natural gas consumed for power generation for any given hour across 2021, 2022, and 2023. The EIA calculated this based on the 24-hour increments of data for the lower 48 states in the U.S. which are reported to Form EIA-930. The EIA maintains that the increased reliance of natural gas for power generation is the result of coal retirements, the low natural gas prices seen in 2023, in addition to the increase in natural gas-fired electricity generating capacity. Of note, off-peak natural gas-fired power generation rose 22 percent between 2021 and 2023, effectively displacing coal-fired units as a source of electricity during the night.
Taking a closer look, demand for natural gas rose an average of 5.1 Bcf per day from the week prior as reported by the EIA. The rise from 68.6 to 73.7 Bcf per day was primarily the result of the 5.6 Bcf per day increase in consumption in the residential and commercial sectors from 14.7 to 20.3 Bcf per day. The roughly 38 percent rise in consumption in the residential and commercial sectors is primarily due to the cooler temperatures in the Mid-West and East during this report period.
Production
– The EIA reports a marginal decline of 0.4 Bcf per day in production from 99.6 to 99.2 Bcf per day for the week ending May 1. In related news, an article published in E&E news highlighted the Mountain Valley Pipeline, LLC FERC filing requesting approval to place the facilities in service by May 23 2024 as the project is “now nearing completion and will be ready for service in May.” The pipeline, once active, will begin transport of up to 2 Bcf per day of natural gas produced in the Marcellus and Utica shale regions to markets in the Mid and South Atlantic regions of the U.S.
LNG Markets
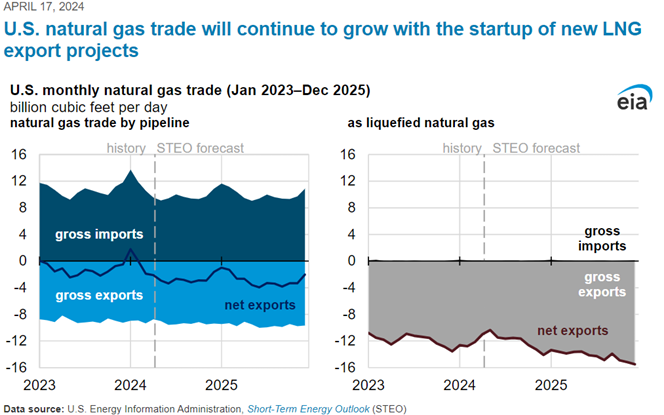
The April 17 release of the EIA Today in Energy forecasts that U.S. LNG exports will continue to lead the growth in U.S. natural gas trade. The EIA attributes this growth to the four LNG projects under construction, which are expected to be completed by the end of 2025. Using data from the EIA Short-Term Energy Outlook, the analysis indicates that net exports of U.S. natural gas will grow six percent to 13.6 Bcf per day in 2024 as compared to 2023. The EIA forecasts an additional 2.8 Bcf per day in growth to 16.4 Bcf per day in 2025. Additionally, the EIA forecasts U.S. LNG exports to increase roughly two percent in 2024 to an average of 12.2 Bcf per day, with an additional eighteen percent growth in 2025.
In more recent news, the EIA Natural Gas Weekly Update reports that the average gas deliveries to U.S. export terminals increased 0.7 Bcf per day week-over-week from 11.5 to 12.2 Bcf per day for the week ending May 1. Natural gas deliveries to terminals in South Louisiana and South Texas both increased this report week, 0.4 and 0.3 Bcf per day, respectively. Deliveries could grow even more in the coming weeks as the Freeport facility ramps up activity. 22 LNG vessels with a combined LNG-carrying capacity of 80 Bcf departed the U.S. between April 25 and May 1.
International prices were mixed for the week ending May 1. Futures at JKM declined $0.21 for a weekly average of $10.31 per MMBtu while futures at TTF declined $0.30 to a weekly average of $9.07 per MMBtu. Given the decline in prices in JKM, futures are $1.39 below one year ago prices of $11.90 out of the East Asia hub.
Working Gas in Underground Storage
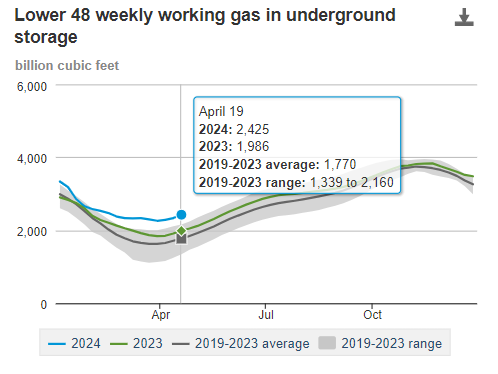
The beginning of refill season continues with strong natural gas injections into storage as the Energy Information Administration Natural Gas Storage Dashboard reports 59 Bcf injected into storage for the week ending May 2. The addition of 59 Bcf to storage places working gas in underground storage at 2,484 Bcf, roughly 642 Bcf (35 percent) higher than the five-year average. Current levels are also 21 percent higher than at the same time last year, potentially a result of underground storage across the country already being roughly 60 percent full.
Pipeline Imports and Exports
Imports from Canada have declined an average of 0.1 Bcf per day from 5.2 to 5.1 Bcf per day for the week ending May 1. Inversely, exports to Mexico have increased week-over-week from 6.4 to 6.5 Bcf per day.
Rig Count
Baker Hughes reports a total of 613 rigs for the week ending April 26, a week-over-week decline of five oil-directed rigs and one gas-directed rig. The total of 613 rigs represents a 142 rig decline from the same time last year. Notably, gas-directed rigs have fallen by 56 rigs year-over-year from 161 rigs last year to 105 for this report week.
For questions please contact Juan Alvarado | jalvarado@aga.org or Morgan Hoy | mhoy@aga.org
To be added to the distribution list for this report, please notify Lucy Castaneda-Land | lcastaneda-land@aga.org
NOTICE
In issuing and making this publication available, AGA is not undertaking to render professional or other services for or on behalf of any person or entity. Nor is AGA undertaking to perform any duty owed by any person or entity to someone else. Anyone using this document should rely on his or her own independent judgment or, as appropriate, seek the advice of a competent professional in determining the exercise of reasonable care in any given circumstances. The statements in this publication are for general information and represent an unaudited compilation of statistical information that could contain coding or processing errors. AGA makes no warranties, express or implied, nor representations about the accuracy of the information in the publication or its appropriateness for any given purpose or situation. This publication shall not be construed as including, advice, guidance, or recommendations to take, or not to take, any actions or decisions regarding any matter, including without limitation relating to investments or the purchase or sale of any securities, shares or other assets of any kind. Should you take any such action or decision; you do so at your own risk. Information on the topics covered by this publication may be available from other sources, which the user may wish to consult for additional views or information not covered by this publication.
Copyright © 2024 American Gas Association. All rights reserved.