Natural Gas Market Indicators – November 13, 2025
496 editions (and counting!) of data, trends, and natural gas market insights. NGMI’s 500th edition will launch in January 2026. Thank you for being part of the journey!
Natural Gas Market Summary
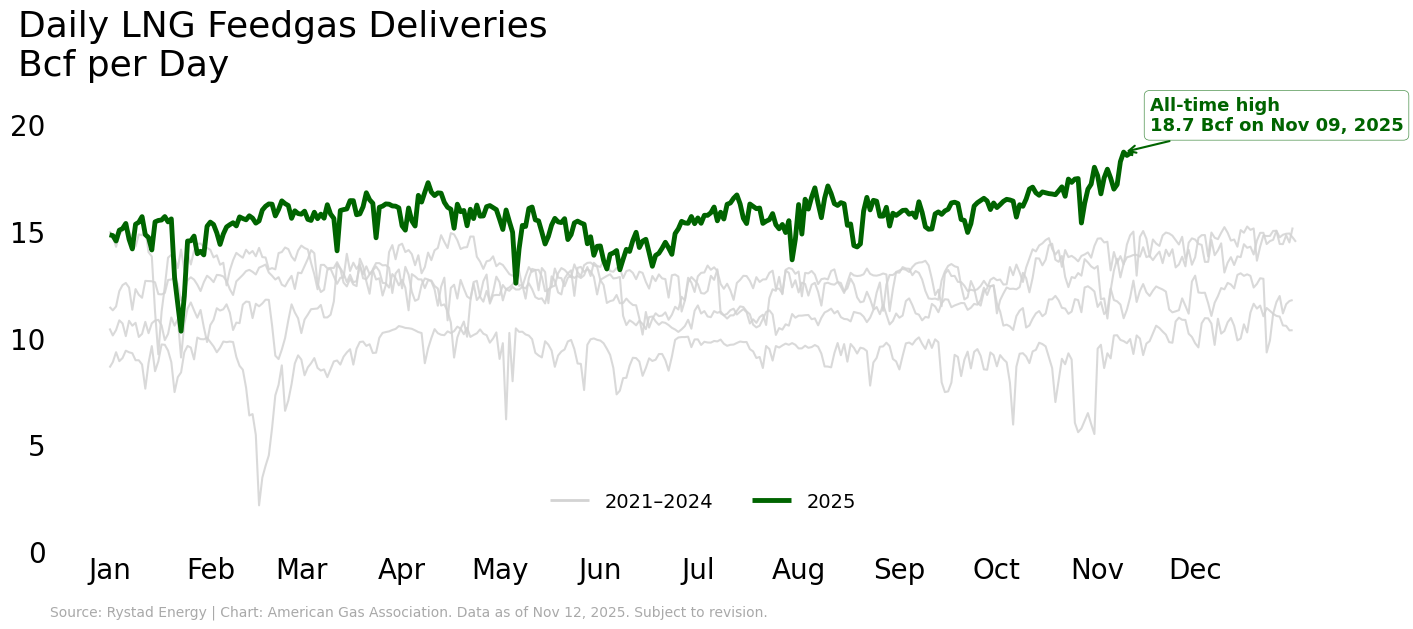
The winter heating season commenced with momentum in demand. LNG feedgas flows surged to nearly 19 Bcf per day, setting new records after matching April’s peak just weeks earlier. Year-to-date, total natural gas demand, including exports, is on track to set a new annual record, averaging 2.5 percent higher than last year as of November 11, according to preliminary data from S&P Global Commodity Insights (S&P Global).
At Henry Hub, recent bullish movements in the prompt-month price are likely due in part to transitory cold weather and a modest addition to underground natural gas storage inventories for the last week of October. Adding to demand, an early-season Arctic blast moved south through the Eastern U.S., bringing historic cold to Florida on November 11, according to Dr. Ryan Maue of Weather Trader. Meanwhile, a 33 Bcf build for the week ending October 31 maintained a surplus to the five-year average in the lower 48, but resulted in a 0.2 percent deficit to year-ago levels.
Futures Prices Rise as Winter Weather Begins
After opening just below $4 as the prompt month rolled over on October 30, December 2025 Henry Hub contracts are up 14.6 percent, settling at $4.53 per MMBtu on November 12. The 12-month strip price settled at $4.20 per MMBtu on the 12th, up nearly 4 percent week-over-week and 2.6 percent higher than the first trading day in November.
According to Argus, average regional spot prices for the month of October:
- Were highest in Louisiana and the Southeast, averaging $3.12 per MMBtu
- Were lowest in the Southwest, averaging $1.20 per MMBtu
- Ranged between $2.22 per MMBtu in the Appalachia and $2.90 per MMBtu in East Texas in other U.S. regions
Winter Heating Begins, Cooler Temperatures than Last Year
October was 15.1 percent colder than last year, but still 19 percent warmer than the 30-year normal, according to gas customer-weighted heating degree days (HDDs). November began similarly as U.S. temperatures were 21.8 percent colder than last year but 15.9 percent warmer than normal for the week ending November 8.
The east may be getting a reprieve in colder temperatures while the west finds itself with more heating demand. The National Oceanic and Atmospheric Administration (NOAA) forecasts above-normal temperatures across much of the eastern half of the U.S. for late November, and near- to below-normal temperatures in the western half of the country. Probabilities for above-normal temperatures are as high as 80 percent across northern Michigan and Wisconsin, while chances for below-normal temperatures reach up to 60 percent in southern California, Nevada, and New Mexico.
Record-Setting Demand Trajectory Continues
U.S. natural gas demand including exports is on track to set a new annual record, averaging 105.5 Bcf per day through September, which is 3.1 percent higher than the annual 2024 record, according to data from Rystad Energy. Including the October forecast for LNG exports and pipeline exports to Mexico, every month in 2025 except March has exceeded historical monthly consumption highs. LNG exports remain one of the primary drivers of rising natural gas demand, though domestic consumption in the power, industrial, and residential sectors has also continued to expand.
Preliminary weekly data from S&P Global indicate that this momentum is expected to continue into November, with total demand increasing 9 percent week over week and 15 percent year over year for the week ending November 13. Domestic consumption rose 6.8 percent, led by strong residential and commercial growth, while industrial and power demand saw more moderate gains.
As of November 13, month-to-date average daily demand remains 2.6 percent above the 2023 record for the month. Rystad Energy forecasts 94.9 Bcf per day of domestic natural gas demand in November, a 0.8 percent increase over the 2023 record.
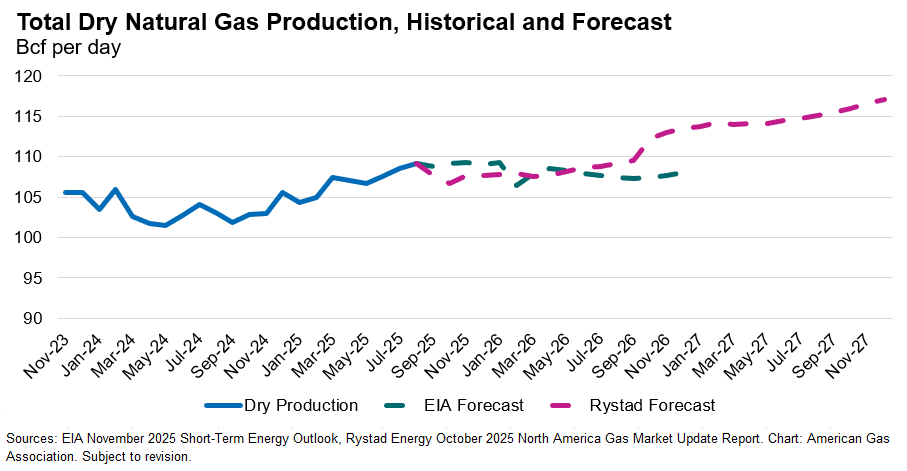
Production Higher YoY Despite Softer October Data
Dry natural gas production averaged 106.7 Bcf per day in October, according to data from Rystad Energy. Although production was down nearly 1 percent month over month, compared to October 2024, it is up 3.5 percent overall. For the year to date through November 13, preliminary data from S&P Global suggest that production is 4.1 percent higher than during the same period last year.
Looking ahead, current Energy Information Administration (EIA) and Rystad Energy forecasts project 2025 natural gas production to be 4.4 percent and 3.7 percent higher, respectively, than 2024 levels. Into 2026, the EIA’s current forecast anticipates flat production, while Rystad Energy projects production to increase more than 2 percent over 2025 levels, averaging 109.5 Bcf per day next year.
New Daily Record for LNG Feedgas
LNG feedgas continues to shatter records. After reaching a new all-time high on October 26, preliminary data from Rystad Energy shows that capacity at export facilities has continued to ramp higher, reaching 18.7 Bcf per day on November 9. Record feedgas levels reflect the rapid commissioning of Venture Global’s Plaquemines LNG—the fastest ramp-up of any U.S. export terminal to date—and steady increases at Cheniere’s Corpus Christi Stage III, both of which are adding substantial new liquefaction capacity along the Gulf Coast. Feedgas averaged 18.1 Bcf per day for the week ending November 12, a 33 percent increase over the same period in 2024.
Thirty-four vessels with a combined carrying capacity of 128 Bcf departed the United States between October 30 and November 5, according to shipping data from Bloomberg Finance. While the number of ships departing from the U.S. remained flat compared to last year, total carrying capacity decreased by 1 Bcf. Year-to-date through October, Reuters reports that U.S. LNG producers have signed nearly 30 million metric tonnes per annum (mtpa) in sales and purchase agreements (SPAs). By comparison, 2024 SPAs reached about 7 mtpa for the calendar year.
Looking ahead, strong LNG demand is expected to continue. Golden Pass LNG is anticipated to begin operations as early as December, with Train 1 adding up to 760 MMcf per day in feedgas demand, according to Natural Gas Intelligence. Once fully commissioned, the facility is expected to contribute up to 2.6 Bcf per day in export capacity. The startup marks the next major expansion of the U.S. LNG market and is likely to push feedgas flows even higher as the project comes online. At the same time, global trade dynamics are shifting. According to Reuters, the UK plans to ban maritime services, including shipping and insurance, for Russian LNG exports, with full implementation slated for 2026. These measures leverage the UK’s dominance in marine insurance and could meaningfully curtail Russian LNG exports.
Mixed Cross-Border Pipeline Trends Persist in November
Exports to Mexico averaged 6.2 Bcf per day, down 0.6 percent week-over-week, but 3 percent higher than during the same week last year, according to data from Rystad Energy for the week ending November 12. In contrast, imports from Canada increased week-over-week by 9.4 percent but were down 1.7 percent relative to the same week last year.
Number of Gas Rigs Increases in the First Week of November
According to Baker Hughes, the U.S. gained three natural gas rigs for the week ending November 7, bringing the total number of natural gas rigs to 128. Compared to the same week last year, the number of gas rigs is up 25.5 percent. The oil rig count remained flat for the week at 414 but lagged year-ago levels by 13.6 percent.
Regional Storage Inventories Mixed as Winter Heating Season Begins
The EIA reported a net injection of 33 Bcf into underground natural gas storage for the week ending October 31, bringing total lower 48 inventories to 3.9 Tcf. With this build, storage levels stand 4.3 percent above the five-year average but 0.2 percent below last year’s levels.
All regions currently hold surpluses relative to the five-year norm—ranging from 0.9 percent in the Midwest to 19.5 percent in the Mountain region—with the exception of the East, which remains 0.2 percent below its five-year average. Compared with year-ago levels, only the Pacific and South Central regions show inventory surpluses, while the East posts the largest year-over-year deficit at 2.5 percent.
What to Watch:
- Demand: Total natural gas demand, including exports, is on track to set a new annual record. Will end-of-year weather push this trajectory higher?
- LNG Feedgas: With daily feedgas flows setting consecutive daily records, could the U.S. realize delivery levels above 20 Bcf per day before year-end?
- Production: Although flowing gas output has backed off from its new monthly record in June 2025, dry natural gas production remains about 4 percent above year-ago levels. Will production stay flat this winter, or will producers respond as prices rise?
For questions please contact Juan Alvarado | jalvarado@aga.org, Liz Pardue | lpardue@aga.org, or
Lauren Scott | lscott@aga.org
To be added to the distribution list for this report, please notify Lucy Castaneda-Land | lcastaneda-land@aga.org
NOTICE
In issuing and making this publication available, AGA is not undertaking to render professional or other services for or on behalf of any person or entity. Nor is AGA undertaking to perform any duty owed by any person or entity to someone else. Anyone using this document should rely on his or her own independent judgment or, as appropriate, seek the advice of a competent professional in determining the exercise of reasonable care in any given circumstances. The statements in this publication are for general information and represent an unaudited compilation of statistical information that could contain coding or processing errors. AGA makes no warranties, express or implied, nor representations about the accuracy of the information in the publication or its appropriateness for any given purpose or situation. This publication shall not be construed as including advice, guidance, or recommendations to take, or not to take, any actions or decisions regarding any matter, including, without limitation, relating to investments or the purchase or sale of any securities, shares or other assets of any kind. Should you take any such action or decision; you do so at your own risk. Information on the topics covered by this publication may be available from other sources, which the user may wish to consult for additional views or information not covered by this publication.
Copyright © 2025 American Gas Association. All rights reserved.Natural Gas Market Indicators – June 6, 2025