Natural Gas Market Indicators – November 14, 2023
Natural Gas Market Summary
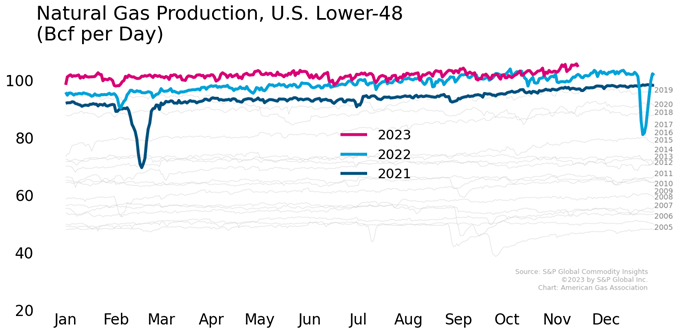
Daily natural gas production reached a preliminary record high in early November, according to data from S&P Global Commodity Insights. Lower-48 dry production reached above the 105 Bcf per day mark, as volume growth year over year in the Northeast and Texas has contributed to higher flowing production. The combination of robust gas supplies and moderate gas demand will likely further boost inventory levels as the winter heating season approaches. The market has rationalized these and other indicators with next-month pricing at Henry Hub around $3.15 per MMBtu.
Reported Prices
December futures have declined to $3.16 per MMBtu as of November 14, according to data from CME. January contracts are trading slightly higher at $3.36 per MMBtu. Over the second week of November, prompt month futures closed at the lowest prices since July 2021. The relatively low prices are shaped by relatively warm weather, robust, record-setting production, and strong storage stocks.
Weather
In the last edition, we noted upcoming colder temperatures in the forecast from NOAA. They arrived the week ending November 4 saw temperatures, as measured by heating degree days (HDDs), that were 64 percent higher (colder) than last year and 18 percent higher than the 30-year average. All regions posted colder-than-normal HDDs except the Pacific region. Since then, temperatures have warmed. Looking ahead, NOAA is forecasting lower-than-normal temperatures across the West and Midwest today through the end of the week as moderate conditions push East and remain through next week.
Demand
Total natural gas consumption increased from 70.2 to 81.5 Bcf per day for the week ending November 1, according to data from the Energy Information Administration. Increased residential and commercial demand drove much of the increase as heating demand pushed consumption higher as the month opened. The following week ending November 8 saw a slight decline in demand to 77.0 Bcf per day. Half of the decline was due to lower volumes directed to power generation; about 40 percent was lower residential and commercial consumption as temperatures eased.
Production
S&P Global Commodity Insights reports preliminary record-setting production levels as initial data shows output in the lower 48 reached 104.9 Bcf per day on November 6. This data is still subject to revision. At these levels, flowing production volumes are more than 4 Bcf per day higher than in November 2022.
Pipeline Imports and Exports
The EIA reports that pipeline imports from Canada increased 0.3 Bcf per day week-over-week from 5.2 to 5.5. Alternatively, pipeline exports to Mexico marginally declined from an average of 6.4 to 6.3 Bcf per day for the week ending November 1.
LNG Markets
According to the EIA’s Natural Gas Weekly Update, natural gas deliveries to U.S. LNG terminals are flowing at 13.9 Bcf per day for the week ending November 8.
European Union storage inventories in Europe are at record highs while natural gas demand continues to fall. These market factors may be putting pressure on prices. Dutch (TTF) futures for January 2024 delivery have fallen by about $3 to $15.65 per MMBtu. Next month LNG futures at JKM in East Asia are currently $17.20 per MMBtu.
On October 27, Freeport LNG received a letter of approval from FERC to begin commissioning the facilities needed to return the second loading dock to service at the Freeport LNG export terminal. Although another step toward complete reinstatement of operations, Freeport LNG will need additional authorization to reinstate service for Loop 2 LNG circulation to enable ship loading at the second dock. In other LNG news, Venture Global LNG received authorization from FERC to place in-service liquefaction blocks seven through nine at the Calcasieu Pass LNG export terminal. All blocks of two liquefaction units will now be in service at the terminal. In addition, FERC also authorized the modified commissioning plan to place phase 3 facilities in service.
Working Gas in Underground Storage
Storage capacity across all regions is trending above average as withdrawal season began on November 1, with total capacity in the East filled to 94 percent. Working gas in underground storage is 3,779 Bcf as of October 27, a 79 Bcf increase week-over-week. Gas stocks are 5.7 percent higher than the five-year average and eight percent higher year-over-year.
Rig Count
Baker Hughes reports that the total rig count in the U.S. declined week-over-week with the removal of eight oil-commissioned rigs and the addition of one gas-directed rig for the week ending November 3. Although total rigs have been on a general decline in 2023, the EIA’s Natural Gas Weekly Update reports that associated natural gas production from the top three top-producing oil plays in the Permian has increased from 4.7 Bcf per day to 13.7 Bcf per day in the first seven months of 2023. The increase in the gas-to-oil ratio of the oil wells in the Wolfcamp, Spraberry, and Bone Spring oil plays in the Permian region could indicate that natural gas production may remain high even if natural gas-directed rigs decline.
For questions please contact Juan Alvarado | jalvarado@aga.org or Morgan Hoy | mhoy@aga.orgTo be added to the distribution list for this report, please notify Lucy Castaneda-Land | lcastaneda-land@aga.org
NOTICE
In issuing and making this publication available, AGA is not undertaking to render professional or other services for or on behalf of any person or entity. Nor is AGA undertaking to perform any duty owed by any person or entity to someone else. Anyone using this document should rely on his or her own independent judgment or, as appropriate, seek the advice of a competent professional in determining the exercise of reasonable care in any given circumstances. The statements in this publication are for general information and represent an unaudited compilation of statistical information that could contain coding or processing errors. AGA makes no warranties, express or implied, nor representations about the accuracy of the information in the publication or its appropriateness for any given purpose or situation. This publication shall not be construed as including, advice, guidance, or recommendations to take, or not to take, any actions or decisions any matter, including without limitation relating to investments or the purchase or sale of any securities, shares or other assets of any kind. Should you take any such action or decision; you do so at your own risk. Information on the topics covered by this publication may be available from other sources, which the user may wish to consult for additional views or information not covered by this publication.
Copyright © 2023 American Gas Association