Natural Gas Market Indicators – November 24, 2025
497 editions (and counting!) of data, trends, and natural gas market insights. NGMI’s 500th edition will launch in January 2026. Thank you for being part of the journey!
Natural Gas Market Summary
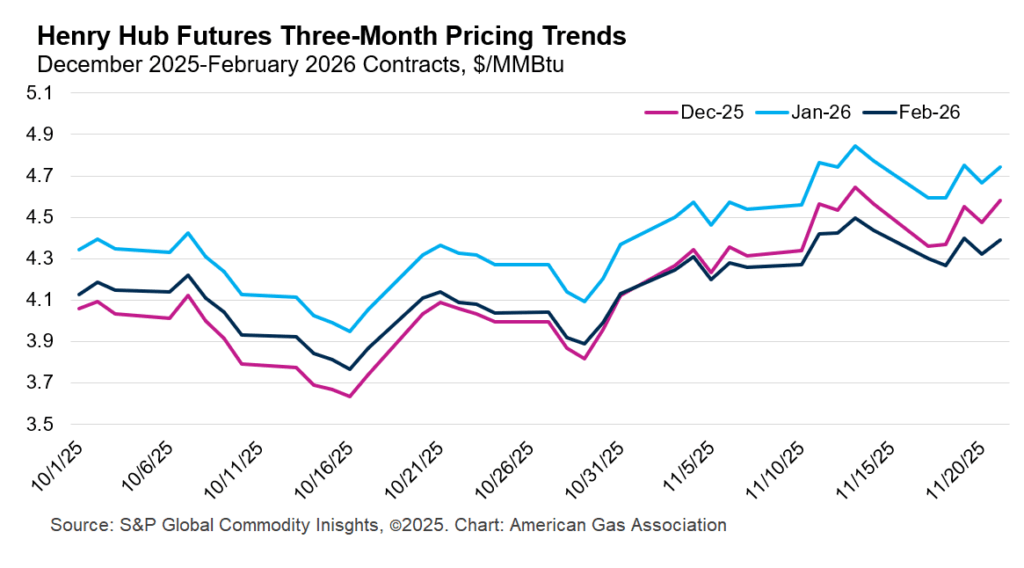
Natural gas futures experienced a brief mid-November pullback, but the latest trading data indicate the decline has largely stabilized. After climbing sharply between October 30 and November 13, Henry Hub futures dropped nearly 7 percent over two trading days before recovering to $4.58 per MMBtu as of November 21. The moderation in upside momentum reflects a combination of factors, including mixed early-December temperature forecasts, continued production strength near record levels, and robust storage inventories. Together, these factors have likely contributed to narrower spreads across the winter strip. Is the market reassessing how quickly colder conditions will materialize and translate into stronger heating demand?
Meanwhile, winter conditions have settled into some parts of the U.S., driving demand growth. Residential and commercial consumption has climbed sharply month-to-date as heating loads increase, contributing the largest share of incremental demand growth in November compared to last year. LNG feedgas flows remain above 18 Bcf per day, and imports from Canada have strengthened in tandem with early-season cold in the northern tier. With production averaging near 109 Bcf per day and storage inventories 3.8 percent above the five-year average, the persistence of colder temperatures remains a key driver of upside risk in the market.
Prices Soften in Mid-November
The upward momentum in natural gas futures briefly softened in mid-November. From October 30 to November 13, the Henry Hub prompt-month contract increased from $3.96 per MMBtu to $4.65 per MMBtu, averaging an increase of approximately 2 percent per day. Prompt-month prices have since dropped, falling nearly 7 percent over two trading days to $4.36 per MMBtu on November 17. However, the pullback proved short-lived. Prompt-month prices firmed again in subsequent sessions, rising to $4.58 per MMBtu as of November 21, recovering most of the mid-month decline.
Looking ahead, the January and February 2026 contracts have generally tracked the prompt month’s recent movements. However, price spreads relative to December 2025 provide a more nuanced view. The January 2026 premium over December 2025 reached a maximum of 9 percent in early October before narrowing to roughly 4 percent in mid-November. Similarly, the February 2026 premium over December ranged from 2 to 4 percent in early October before narrowing in November. By November 1, February prices had declined enough to shift this premium into a discount, averaging 1.8 percent below December as of November 11. These shifts suggest that while near-term weather signals remain mixed, traders are placing greater emphasis on December and January, likely due to higher confidence in short-term forecasts.
Temperature Forecasts Mixed into Early December
Total U.S. natural gas demand, including exports, is up 12.7 percent for the month to date through November 24 and 10.5 percent higher than the same period last year, according to preliminary data from S&P Global Commodity Insights (S&P Global). The increase is being driven primarily by rising consumption in the residential and commercial sectors, as heating demand increases with the arrival of colder temperatures. Residential and commercial demand has nearly doubled compared to the first 24 days of October 2025 and is 23.6 percent higher than the same period last year. Industrial sector consumption has also strengthened, rising 5.8 percent month-to-date from October and 1.6 percent compared to year-ago levels.
By comparison, data from Rystad Energy indicate that natural gas demand in the electric power sector is down 9 percent for the month to date through November 22, compared to October month-to-date levels, and 7.3 percent lower year-over-year. For the year to date, power sector demand is down nearly 3 percent.
Demand Higher as HDDs Accumulate
U.S. natural gas demand including exports is on track to set a new annual record, averaging 105.5 Bcf per day through September, which is 3.1 percent higher than the annual 2024 record, according to data from Rystad Energy. Including the October forecast for LNG exports and pipeline exports to Mexico, every month in 2025 except March has exceeded historical monthly consumption highs. LNG exports remain one of the primary drivers of rising natural gas demand, though domestic consumption in the power, industrial, and residential sectors has also continued to expand.
Preliminary weekly data from S&P Global indicate that this momentum is expected to continue into November, with total demand increasing 9 percent week over week and 15 percent year over year for the week ending November 13. Domestic consumption rose 6.8 percent, led by strong residential and commercial growth, while industrial and power demand saw more moderate gains.
As of November 13, month-to-date average daily demand remains 2.6 percent above the 2023 record for the month. Rystad Energy forecasts 94.9 Bcf per day of domestic natural gas demand in November, a 0.8 percent increase over the 2023 record.
Average November Production Nears 109 Bcf per Day
Between November 1 and 23, preliminary data from Rystad Energy reports that dry natural gas production averaged 108.5 Bcf per day, 0.8 percent above the current November forecast. For the week ending November 23, production averaged 108 Bcf per day, declining 1.1 percent from last week and increasing by 2.1 percent over the same period last year.
Year-over-year production gains may be aided by strong associated gas production gains last year. The EIA reports that 2024 associated natural gas output rose 6 percent over 2023 to an average of 18.5 Bcf per day, with most of the growth driven by ongoing expansion in the Permian Basin.
LNG Feedgas Flows Remain Strong
U.S. LNG feedgas deliveries have exceeded 18 Bcf per day for 15 of the last 16 days, according to preliminary data from Rystad Energy. For the month to date through November 23, feedgas flows have averaged 18.1 Bcf per day, 9 percent higher than the previous month and 35.2 percent higher than the same period last year. Year to date, LNG feedgas flows are up more than 22 percent.
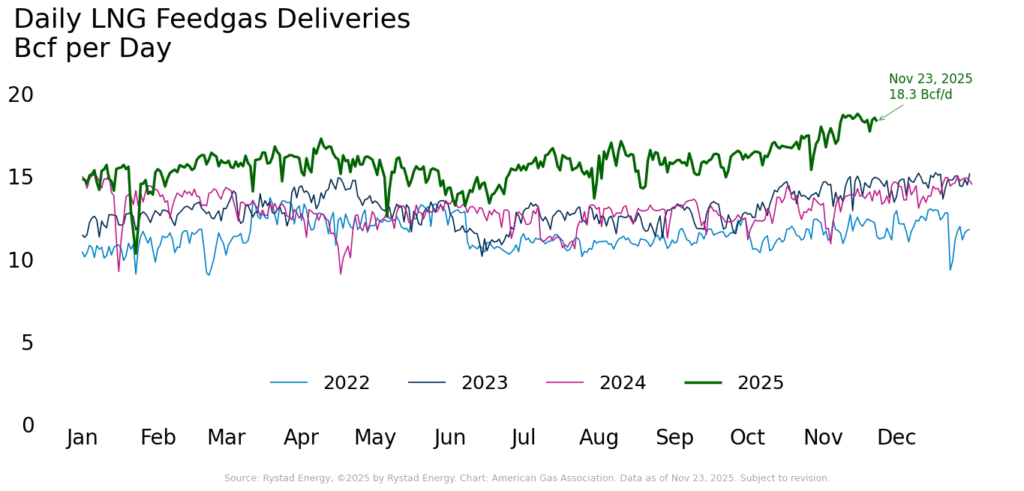
From the perspective of exports, the EIA reports that 34 LNG vessels with a combined carrying capacity of 129 Bcf departed the U.S. during the week ending November 12.
Winter Withdrawals Begin
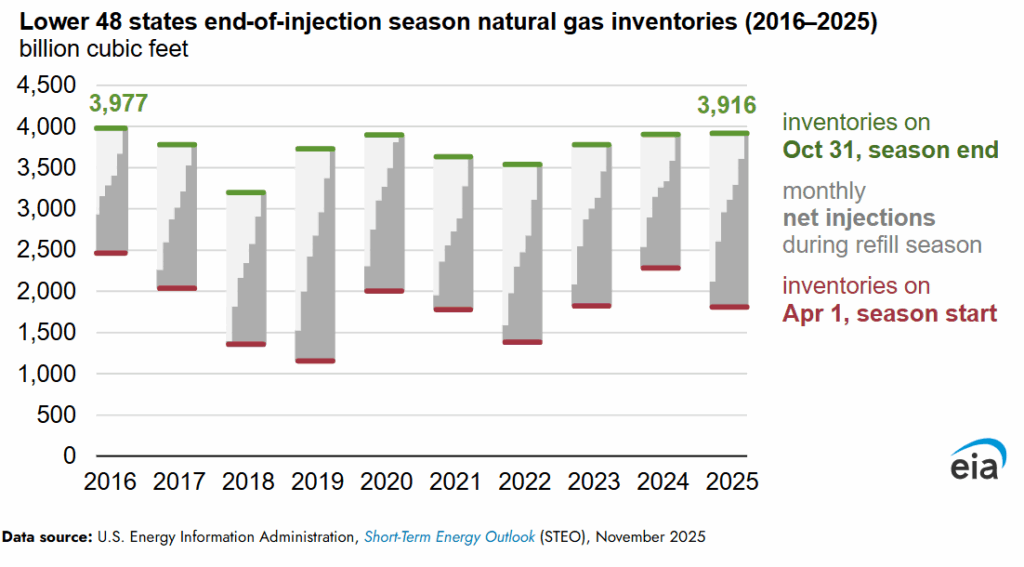
U.S. natural gas inventories entered the 2025-2026 winter with the highest inventory levels since 2016, according to the EIA. Working gas inventories reached 3,916 Bcf by October 31, the result of a strong injection season that saw the fastest rebuild pace since 2019. And now the withdrawal season is officially underway. For the first time since March, the EIA reported a decline in inventories to 3,946 Bcf, down 0.4 percent for the week ending November 14.
Storage inventories remain well-equipped to meet rising winter demand, sitting 3.8 percent above the five-year average. This pattern is broadly reflected across the regions, with all but the East exceeding their respective five-year averages. Regional differences range from 1.2 percent below the five-year average in the East to 21.2 percent above in the Mountain region.
Natural Gas Imports from Canada Up Year-to-Date
According to preliminary data from Rystad Energy, Canadian natural gas imports have risen 17.2 percent for the month to date through November 23 but lag the same period last year by nearly 1 percent. By comparison, exports to Mexico are down 9.4 percent month-over-month and 3.3 percent lower than year-ago levels. Year-to-date, imports from Canada are up nearly 6 percent compared to last year, while exports to Mexico are 1.2 percent lower.
Drilling Efficiencies Keep Gas Rigs Strong Year Over Year
According to Baker Hughes, U.S. natural gas rigs increased by two for the week ending November 21, bringing the total to 127. Rig activity remains elevated compared to year-ago levels, up by 28 rigs, or 28.3 percent. Oil rigs increased by two week-over-week but continue to trail last year’s count by 60 rigs, or 12.5 percent. Eight miscellaneous rigs for the week brought the total count to 554, a 5 percent decline from last year’s level.
The EIA attributes the total rig count decline to drilling efficiency improvements and rig operators’ responses to crude oil and gas prices. With technological advancements, the traditional relationship between production output and rig count may be weakening, as production of crude oil and natural gas reached record highs in October 2025.
What to Watch:
- Pipeline Flows: U.S. imports of Canadian natural gas have run above October levels so far in November. With colder weather expected across parts of the country, how much higher could import volumes climb before year-end?
- Storage: With the first lower 48 net underground storage withdrawal recorded for the 2025-2026 winter heating season and colder-than-normal temperatures in the forecast, where will inventories stand at the start of 2026?
- Prices: Since the December contract rolled into the prompt month, the spread between the 12-month strip and the settled futures price has remained negative. Will this spread turn positive before the end of 2025?
For questions please contact Juan Alvarado | jalvarado@aga.org, Liz Pardue | lpardue@aga.org, or
Lauren Scott | lscott@aga.org
To be added to the distribution list for this report, please notify Lucy Castaneda-Land | lcastaneda-land@aga.org
NOTICE
In issuing and making this publication available, AGA is not undertaking to render professional or other services for or on behalf of any person or entity. Nor is AGA undertaking to perform any duty owed by any person or entity to someone else. Anyone using this document should rely on his or her own independent judgment or, as appropriate, seek the advice of a competent professional in determining the exercise of reasonable care in any given circumstances. The statements in this publication are for general information and represent an unaudited compilation of statistical information that could contain coding or processing errors. AGA makes no warranties, express or implied, nor representations about the accuracy of the information in the publication or its appropriateness for any given purpose or situation. This publication shall not be construed as including advice, guidance, or recommendations to take, or not to take, any actions or decisions regarding any matter, including, without limitation, relating to investments or the purchase or sale of any securities, shares or other assets of any kind. Should you take any such action or decision; you do so at your own risk. Information on the topics covered by this publication may be available from other sources, which the user may wish to consult for additional views or information not covered by this publication.
Copyright © 2025 American Gas Association. All rights reserved.Natural Gas Market Indicators – June 6, 2025