Natural Gas Market Indicators -November 8, 2024
Natural Gas Market Summary
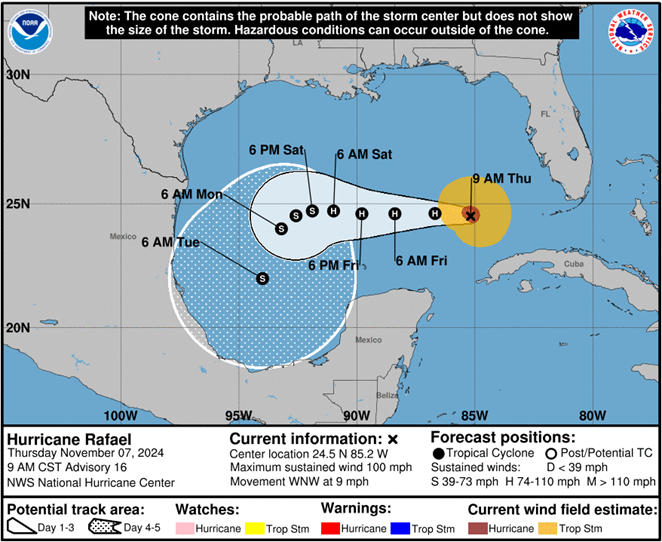
The Atlantic hurricane season presses on as Rafael becomes the 11th named hurricane of 2024. The hurricane made landfall in Cuba as a Category 3 storm Wednesday, and as of Thursday morning is moving into the Gulf of Mexico according to the National Hurricane Center (NHC) of the National Oceanic and Atmospheric Administration (NOAA). Given its current trajectory, Rafael is expected to weaken as it moves toward Mexico through the weekend. The Associated Press reported that NOAA’s prediction of an above average Atlantic hurricane season is coming to pass; on average, the Atlantic experiences 14 named storms, seven of which are hurricanes. To date, the Atlantic has experienced 17 named storms in 2024 with 11 being of hurricane strength.
Rafael reignited concerns about potential disruptions to natural gas production in the Gulf of Mexico, which contributed to increased futures prices intraday on Tuesday according to FX Empire. However, a mild weather forecast and a robust storage report expected from the EIA bolstered a more bearish sentiment on Thursday morning. With Rafael’s trajectory moving southwest, soft demand expected in the near term, and a shifting political landscape, prices remain mixed moving into the last weeks of the year.
As the U.S. begins the 2024-2025 winter heating season, healthy natural gas supply and storage levels support this price outlook. As of October 25, working gas in storage exceeded the storage levels of both one year ago and the five-year average. Coupled with a mild domestic weather forecast in the short-term, suggesting the U.S. is well-positioned as it enters the colder winter months. The EIA’s October 2024 Short-Term Energy Outlook projects that natural gas storage levels will continue to exceed the five-year average through 2025.
Reported Prices
The November 2024 NYMEX contract expired on October 29 at $2.32 per MMBtu, according to the EIA. CME reports that December Henry Hub futures settled at $2.75 per MMBtu on November 6. This represents a 3 percent increase from the first of the month settlement of $2.66 per MMBtu. Regionally, natural gas spot price changes varied for the week ending October 30. The EIA indicates that price changed ranged from a $0.12 per MMBtu decline at Eastern Gas South to a $1.63 increase at PG&E Citygate.
Weather
For the week ending October 26, U.S. temperatures were 10.5 percent warmer than last year and 40 percent warmer than the 30-year normal based on heating degree days. All regions were warmer than last year except the West North Central, East South Central, West South Central, and Mountain regions.
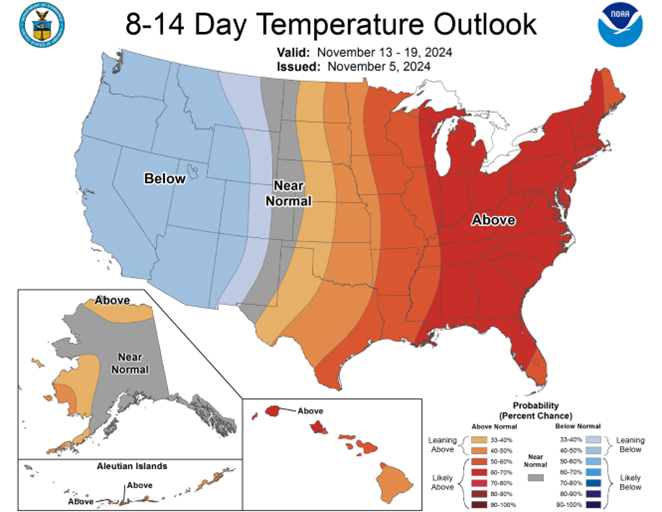
Into mid-November, the temperature outlook for the eastern half of the U.S. is expected to be above normal, while the western half is largely expected to be below normal, according to the National Weather Service Climate Prediction Center.

The NHC is monitoring Hurricane Rafael and a disturbance further out in the Atlantic. As of Thursday morning, the NHC reported that Rafael is expected to maintain hurricane strength into the weekend after making landfall in western Cuba on Wednesday. The storm’s current trajectory shows it turning southwest toward Mexico. The NHC is also monitoring a tropical depression in the Eastern Pacific.

Demand
According to the EIA, total U.S. natural gas consumption increased by 3.1 percent, or 2.2 Bcf per day, for the week ending October 30, driven largely by increased consumption in the residential/commercial sector. Consumption gains in the residential/commercial sector of 5.2 Bcf per day (48.1 percent) were somewhat offset by lower consumption in the power sector, which posted week-over-week losses of 9.3% (3.5 Bcf per day). Industrial sector consumption increased 0.5 Bcf per day (2.2 percent) over this period. Year-over-year, consumption in these sectors is up 8.1 percent, 9.3 percent, and 0.4 percent, respectively.
Production
The EIA reports dry gas production of 103.2 Bcf per day for the week ending October 30, marking a 1.7 Bcf per day increase from last week. Compared to the same period last year, production lagged by 0.5 Bcf per day, a decrease of 0.5 percent.
Additionally, in the first 9 months of 2024, U.S. natural gas production from shale and tight formations decreased slightly compared to the same period last year. From January through September 2024, total U.S. shale gas production declined 1 percent to 81.2 Bcf per day. According to the EIA, if this trend holds for the remainder of 2024, this will mark the first annual decline in U.S. shale gas production since the start of data collection in 2000. This decline is attributed to reduced production in the Haynesville and Utica plays.
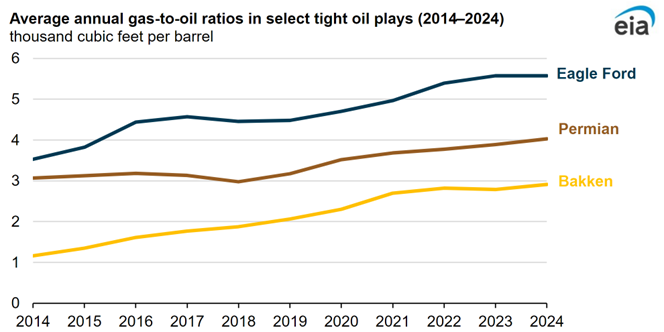
EIA data also indicates the share of natural gas production in the three largest U.S. tight oil plays has increased over the past decade. In 2014, natural gas accounted for 29 percent of total production from the Bakken, Eagle Ford, and Permian plays. For 2024 year-to-date, this share has risen to 40 percent.

LNG Markets
For the week ending October 30, natural gas deliveries to LNG export terminals decreased 0.2 Bcf per day to 13.5 Bcf per day from the previous week, according to the EIA. A total of 24 vessels with a combined carrying capacity of 89 Bcf departed from the U.S. between October 24 and October 30.
Working Gas in Underground Storage
The EIA reports that net injections into underground storage totaled 78 Bcf for the week ending October 25, 107 Bcf (2.8 percent) higher than the same week last year. Total working natural gas stocks of 3,863 Bcf for the week are 5 percent (178 Bcf) higher than the five-year average and 3 percent (107 Bcf) higher than the same period last year.
Pipeline Imports and Exports
The EIA reports net Canadian imports increased 0.4 Bcf per day (7.3 percent) relative to the prior week for the week ending October 30 and exceeded the same period last year by 0.7 Bcf per day (13.5 percent). U.S. exports to Mexico fell 0.7 percent (less than 0.1 Bcf per day) week-over-week and were 3.1 percent (0.2 Bcf per day) lower than the same period last year.
Rig Count
According to Baker Hughes, the total natural gas rig count across the U.S. increased to 101 for the week ending October 22, an increase of two rigs from the previous week. The number of oil-directed rigs decreased to 480, a 0.4 percent change relative to last week. In total, 585 rigs are in operation across the U.S., down 40 rigs from last year.
For questions please contact Juan Alvarado | jalvarado@aga.org, Liz Pardue| lpardue@aga.org, or Lauren Scott | lscott@aga.org
To be added to the distribution list for this report, please notify Lucy Castaneda-Land | lcastaneda-land@aga.org
NOTICE
In issuing and making this publication available, AGA is not undertaking to render professional or other services for or on behalf of any person or entity. Nor is AGA undertaking to perform any duty owed by any person or entity to someone else. Anyone using this document should rely on his or her own independent judgment or, as appropriate, seek the advice of a competent professional in determining the exercise of reasonable care in any given circumstances. The statements in this publication are for general information and represent an unaudited compilation of statistical information that could contain coding or processing errors. AGA makes no warranties, express or implied, nor representations about the accuracy of the information in the publication or its appropriateness for any given purpose or situation. This publication shall not be construed as including, advice, guidance, or recommendations to take, or not to take, any actions or decisions regarding any matter, including without limitation relating to investments or the purchase or sale of any securities, shares or other assets of any kind. Should you take any such action or decision; you do so at your own risk. Information on the topics covered by this publication may be available from other sources, which the user may wish to consult for additional views or information not covered by this publication.
Copyright © 2024 American Gas Association. All rights reserved.Natural Gas Market Indicators – September 12, 2024