Natural Gas Market Indicators – October 15, 2025
Natural Gas Market Summary
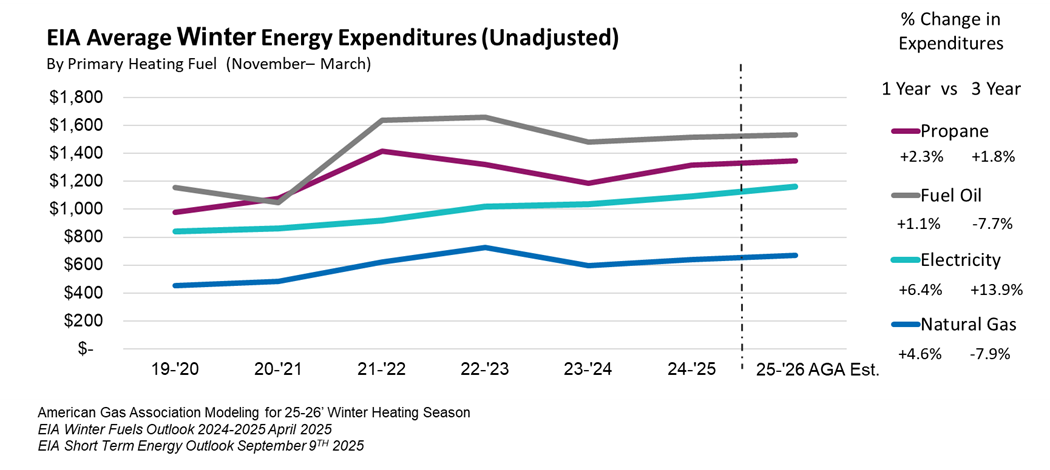
As winter approaches, factors such as temperatures, supply-demand balances, and commodity prices across the U.S. will be among the key drivers of consumer bills during the colder months, as LDCs plan and prepare to meet seasonal demand. AGA’s 2025-2026 Winter Heating Outlook, released on September 29, reviewed how current conditions are shaping the season ahead. Natural gas demand continues to grow, with growth expectations exceeding 5 percent through 2026 relative to 2024 levels. Demand is being met through record production, robust storage inventories, and strategic supply planning by utilities. With natural gas drilling rig count nearly 19 percent higher year-over-year and working gas stocks in the lower 48 above the five-year average, preparedness signals are strong. Temperatures are forecast to be 5 percent colder than last year for the U.S., even amid an anticipated continuation of last year’s La Niña pattern. On average, AGA modeling projects that natural gas bills could be 8 percent lower than three years ago under similar weather conditions. AGA’s outlook also identified how LDCs utilize a variety of supply acquisition tools to construct portfolios that meet peak demand requirements on the coldest day of the year.
November Henry Hub Contract Softens Mid-Month
The November 2025 Henry Hub contract rolled over as the prompt month on September 29, settling at $3.27 per million British thermal units (MMBtu). Since then, the prompt month price has fallen 4.6 percent, settling at $3.12 per MMBtu on October 13. Intraday on October 15, the November contract fell below the $3 per MMBtu mark. The 12-month strip, reflecting the average price for the next 12 months, fell 0.4 percent over this period, settling at $3.76 per MMBtu on October 13.
The Energy Information Administration (EIA) is pulling its price forecast downward. In its October 2025 Short-Term Energy Outlook (STEO), EIA lowered its forecasted average Henry Hub spot price for 2025 to $3.42 per MMBtu, a 2.8 percent downward revision from the September edition. Why? One factor is that EIA increased the natural gas production outlook to 107.1 Bcf per day, a 0.5 percent increase from the prior outlook. Looking at 2026, the EIA estimates spot prices will average $3.94 per MMBtu, 8 percent lower than the September 2025 forecast, again due to higher production expectations next year, with dry gas production rising to 107.4 Bcf per day in 2026.
Argus reports the following average regional spot prices for September 2025:
- Louisiana and the Southeast posted the highest price of $2.94 per MMBtu for the month.
- The Southwest had the lowest regional price of $1.47 per MMBtu.
- Prices in other U.S. regions ranged from $1.79 per MMBtu in Appalachia to $2.75 per MMBtu in East Texas.
Above-normal Temperatures to Continue in October
September was 2.8 percent cooler than last year but 13.5 percent warmer than the 30-year normal, according to monthly cumulative population-weighted cooling degree days (CDDs) published by the National Oceanic and Atmospheric Administration (NOAA). For the week ending October 1, temperatures in the U.S. were 9.4 percent cooler than last year and 35.2 percent warmer than normal.
NOAA predicts that warmer temperature trends will continue, at least through October 27, according to their 8- to 14-day temperature outlook. However, colder temperatures creep into the forecast in the western half of the U.S., where most of the West Coast and the Mountain region are expected to have below-to-near-normal temperatures.
In the Atlantic, NOAA’s National Hurricane Center (NHC) is tracking Tropical Storm Lorenzo as it moves northwestward. Current modeling expects little to no strengthening as the path shifts north and is expected to dissipate by Thursday. In the eastern Pacific, one disturbance is being monitored south of Mexico with a 40 to 60 percent chance of cyclone formation. No other tropical activity is reported in the Pacific at this time.
Domestic Demand Dips while Residential Consumption Hits Record High
Domestic natural gas demand averaged 78.8 Bcf per day in September, 2.3 percent lower than the same period last year, according to data from Rystad Energy. The 1.9 Bcf per day reduction in consumption was largely driven by a 5.2 percent decrease in power sector consumption. Even so, residential demand reached a record high for the month of September, averaging 4.2 Bcf per day, 0.6 percent higher than the previous record set in 2020 and 11.6 percent higher than September 2024.
As October unfolds, Rystad expects strong residential consumption trends to continue. As of October, residential sector demand is forecast to average 8.5 Bcf per day for the month, surpassing the prior October 2018 record by 3.6 percent. Industrial demand is also projected to set a new October high, edging 0.5 percent above the record set in 2023. In total, domestic demand is forecast to reach 81.8 Bcf per day, an increase of 4.1 percent over the October 2023 record.
2025 Production Forecast Increased
Dry natural gas production remains in record territory, averaging 108.1 Bcf per day in September, 0.1 percent higher than August levels and 5.6 percent higher than the same period last year, according to data from Rystad Energy. Through October 14, production is running 4 percent ahead of last year’s pace for the year to date, according to preliminary data from S&P Global.
As noted previously, the EIA revised its 2025 natural gas production estimate upward by 0.5 percent in its October 2025 STEO. Compared to the September STEO, the EIA’s 2026 production forecast increased by 1.3 percent to 107.4 Bcf per day.
U.S. LNG Exports Soar to New Heights
Monthly LNG exports reached two consecutive all-time highs in August and September, surpassing the previous peak of 13.6 Bcf per day recorded in December 2023, according to data from Rystad Energy. Monthly exports climbed to 14.8 Bcf per day in August and increased again in September to 15.1 Bcf per day, rising 8.6 percent and 11 percent, respectively, over the 2023 record. This increase was largely driven by plants exiting maintenance programs in August and the ramp-up of Venture Global’s Plaquemines facility. According to LSEG data reported by Reuters, Plaquemines has increased production every month since opening in December 2024, selling 1.6 million tons of LNG in August, or 17 percent of total U.S. exports. This rapid scale-up is driven by Venture Global’s modular approach to liquefaction trains, which allows for shorter project timelines and enables greater peak capacity.
In September, feedgas flows to LNG terminals averaged 15.9 Bcf per day, 25.1 percent higher than the same period last year, according to data from Rystad Energy. For the week ending October 13, feedgas deliveries averaged 16.5 Bcf per day, rising 0.8 percent over last week and 27.3 percent over the same week in 2024. The EIA reports that between October 2 and October 8, 30 LNG vessels with a combined carrying capacity of 112 Bcf departed the U.S., decreasing by 10 Bcf relative to the previous week from a carrying capacity of 122 Bcf.
Pipeline Flows Declined in September
Net exports to Mexico averaged 6.8 Bcf per day for the month, declining 11.3 percent compared to August and down 1.4 percent compared to September 2024, according to Rystad Energy. Similarly, net imports from Canada declined in September, averaging 5.7 Bcf per day, down 12.3 percent from August flow volumes and falling 1.7 percent compared to September 2024. For the month of October, exports to Mexico are expected to decline month-to-month by 10.2 percent, averaging 6.1 Bcf per day, while imports from Canada are expected to rise by 10.5 percent over September volumes to 6.3 Bcf per day.
U.S. Gains Two Natural Gas Rigs Week-over-Week
The U.S. added two natural gas rigs for the week ending October 10, bringing the total natural gas rig count to 120, according to Baker Hughes. Compared to the same week last year, the number of natural gas rigs is up by 19, representing an 18.8 percent increase. By comparison, the number of oil rigs fell by four for the week and by 63 rigs year-over-year, an annual decline of 13.1 percent. The total U.S. rig count for the week declined by two.
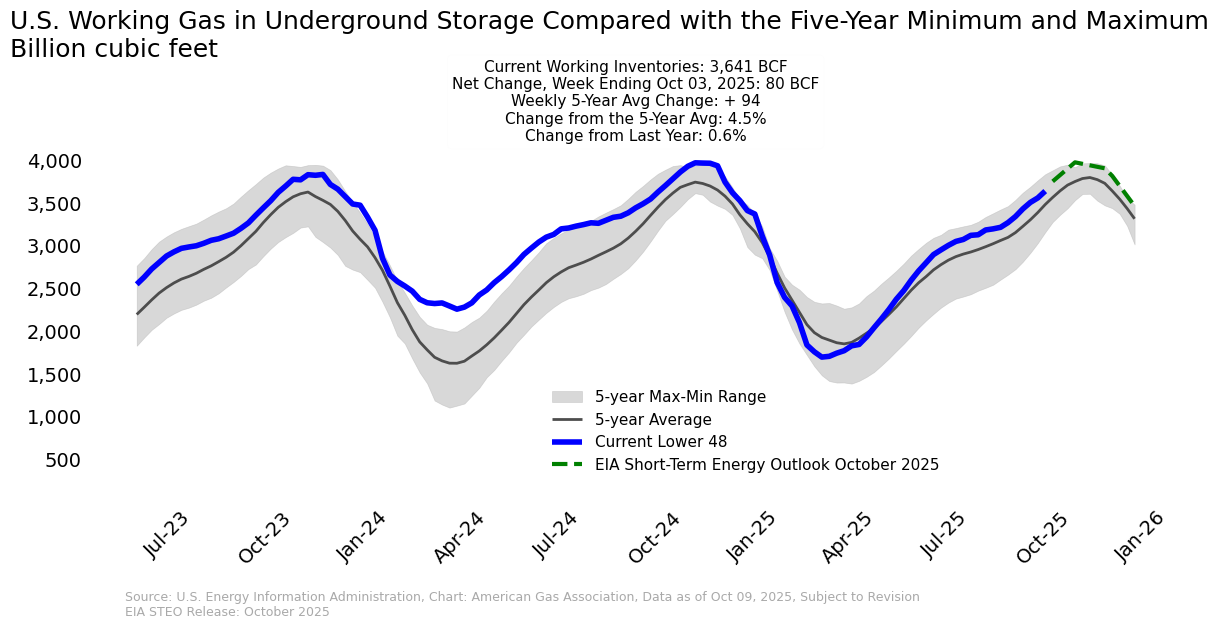
Weekly Net Injection Raises Storage Inventories Above 3.6 Tcf
According to the EIA, net injections of 80 Bcf into underground storage brought total inventory to 3.6 Tcf for the week ending October 3. Underground storage inventories are 4.5 percent above the five-year average for the week and 0.6 percent above year-ago levels as the winter heating season approaches.
Regionally for the week:
- Inventories in all regions except the Midwest are above the five-year average, with the Mountain region having the largest surplus of 18.5 percent.
- The Pacific and South Central are the only regions with storage inventories in excess of year-ago levels. Surpluses are 3.8 percent and 6.0 percent, respectively.
- Regions with deficits to prior year levels range from -3.8 percent in the Mountain region to -1 percent in the East.
In Louisiana, Black Bayou Gas Storage received a Certificate of Public Convenience and Necessity from the Federal Energy Regulatory Commission for a large-scale gas storage hub in Cameron and Calcasieu parishes. The project is designed to leverage four salt dome caverns and connect to ten major interstate pipelines, giving it the ability to help balance the energy needs of consumers and suppliers.
What to Watch:
- LNG: Will record export trends continue into October as the European Union continues to fill storage ahead of winter?
- Prices: If the strong production and robust storage inventory trends continue, will the recent decline in contract prices persist through October?
- Pipeline Flows: With winter ahead, how might import volumes from Canada into the Midwestern and Northeastern markets influence regional pricing trends as the injection season winds down?
For questions please contact Juan Alvarado | jalvarado@aga.org, Liz Pardue | lpardue@aga.org, or
Lauren Scott | lscott@aga.org
To be added to the distribution list for this report, please notify Lucy Castaneda-Land | lcastaneda-land@aga.org
NOTICE
In issuing and making this publication available, AGA is not undertaking to render professional or other services for or on behalf of any person or entity. Nor is AGA undertaking to perform any duty owed by any person or entity to someone else. Anyone using this document should rely on his or her own independent judgment or, as appropriate, seek the advice of a competent professional in determining the exercise of reasonable care in any given circumstances. The statements in this publication are for general information and represent an unaudited compilation of statistical information that could contain coding or processing errors. AGA makes no warranties, express or implied, nor representations about the accuracy of the information in the publication or its appropriateness for any given purpose or situation. This publication shall not be construed as including advice, guidance, or recommendations to take, or not to take, any actions or decisions regarding any matter, including, without limitation, relating to investments or the purchase or sale of any securities, shares or other assets of any kind. Should you take any such action or decision; you do so at your own risk. Information on the topics covered by this publication may be available from other sources, which the user may wish to consult for additional views or information not covered by this publication.
Copyright © 2025 American Gas Association. All rights reserved.Natural Gas Market Indicators – June 6, 2025