Natural Gas Market Indicators – October 18, 2023
Market Summary
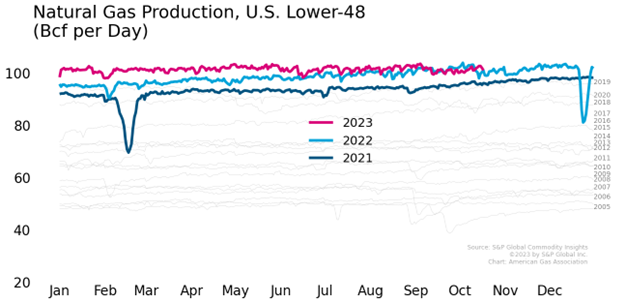
U.S. dry gas production has consistently surpassed output levels observed in 2021 and 2022. This increase in production is in response to growing natural gas demand across multiple sectors, including power generation and exports. The Energy Information Administration (EIA) expects an additional 8.6 gigawatts of gas-fired generation capacity to become operational by the end of this year, suggesting further potential upside to gas power demand into 2024.
Reported Prices
As of this morning, prompt-month futures out of Henry Hub are trading above $3.00 per MMBtu for the first time since February of this year. Spot prices over the last week have fluctuated across the country as temperatures shifted, ranging from drops in prices out of the Waha Hub in West Texas to increases out of SoCal Citygate. As of this morning, spot prices across the country depended on region, with the lowest prices reporting $1.36 per MMBtu out of the Northeast and the highest spot prices out of Northern California at $8.00 per MMBtu.
Weather
Although the end of the Hurricane season won’t come until November 1, there is minimal tropical storm activity in the Atlantic Basin, and no storms are currently expected to impact the U.S. In regards to temperature, NOAA anticipates the remainder of this week is to bring warmer temperatures across the Midwest and West as cooler temperatures settle on the East Coast. These temperatures will effectively switch for the last week of October, bringing warmer temperatures across the East Coast as cooler temperatures push into the Midwest. As the shoulder season concluded and winter heating season begins, so does our reporting of heating degree days. For the week ending October 14, the weather in the U.S. was roughly 12 percent colder than last year and roughly nine percent colder than normal. All regions experienced colder temperatures than last year except the South East Central region. For the month of September the weather in the U.S. was twelve percent warmer than last year, and roughly 33 percent warmer than normal.
Demand
The EIA reported a 1.3 Bcf per day week-over-week increase from 68.6 to 69.9 Bcf per day for the week ending October 11. The roughly two percent week-over-week increase in consumption is thought to be primarily driven by 51 percent increase in consumption from the residential and commercial sectors due to the cooler temperatures that moved across the country. Although the residential and commercial sectors increased consumption, natural gas demand for power generation declined by roughly twelve percent week-over-week. The decline in natural gas demand for power generation and the increase in demand from the residential and commercial sectors reflects the overall shift in temperatures as we exit the shoulder season and enter the winter heating season. The October 16 release of EIA’s Today in Energy unpacked information surrounding the total 8.6 gigawatts of natural gas-fired capacity additions set to come online before the conclusion of 2023. The additions include both combined-cycle gas turbine plants and simple-cycle gas turbine plants. These plants are anticipated to be concentrated in the Appalachia, Permian, Eagle Ford, and Haynesville regions of the U.S. A total of eleven natural gas-fired power plants were added in 2022 adding an additional 5.6 GW of capacity. The additional two GW of natural gas-fired capacity added year-over-year breaks the three-year trend of natural gas-fired capacity removal from 2019 – 2022.
Production
According to EIA data, production has appeared to decrease slightly and is now below October 2022 levels. The EIA reports an average of 101.3 Bcf per day of dry gas production for the week ending October 11. The recently released Drilling Productivity Report from the EIA anticipates a month-over-month increase in dry gas production out of the Anadarko, Appalachia, Eagle Ford, and Haynesville regions for the month of November.
Pipeline Imports and Exports
According to the EIA, pipeline exports to Mexico decreased by roughly three percent to 6.4 Bcf per day for the week ending October 11. Pipeline imports from Canada averaged 5.5 Bcf per day for the same period, a 0.4 Bcf per day increase week-over-week.
LNG Markets
According to the EIA’s Natural Gas Weekly update, average natural gas deliveries to U.S LNG export terminals increased by two percent week-over-week, from an average of 12.4 to 12.7 Bcf per day. The EIA also reports weekly average prompt-month futures out of JKM declined $0.26 to a weekly average of $14.18 per MMBtu, while futures out of the TTF increased $1.17 to a weekly average of $13.28 per MMBtu. Weekly international LNG futures are substantially lower than year-ago levels, dropping $20.63 and $32.55 at JKM and TTF, respectively.
Working Gas in Underground Storage
Weekly natural gas volumes injected into storage totaled 84 Bcf, bringing total working gas in underground storage to 3,529 Bcf for the week ending October 6. The current levels of working gas in underground storage are 163 Bcf, or five percent, higher than the five-year average and ten percent more year-over-year, even though injections are seven percent lower than the five-year average thus far this refill season. All storage regions are now above the five-year average, according to the Energy Information Administration. Storage levels ahead of this winter heating season are of particular interest as storage levels at this time last year were below the five-year average and towards the bottom of the five-year range. This season’s robust storage levels are thought to be the product of consistently high levels of production and lower pricing environment.
Rig Count
Baker Hughes reports that the rig count in the U.S. deviated from the recent downward trend with the addition of three oil-directed rigs for the week ending October 13. Although three additional rigs were added to the overall rig count, one gas-directed rig was removed. The occasional week-over-week additions to the rig count do not change the overall trend of rig declines since the beginning of 2023.
For questions please contact Juan Alvarado | jalvarado@aga.org or Morgan Hoy | mhoy@aga.orgTo be added to the distribution list for this report, please notify Lucy Castaneda-Land | lcastaneda-land@aga.org
NOTICE
In issuing and making this publication available, AGA is not undertaking to render professional or other services for or on behalf of any person or entity. Nor is AGA undertaking to perform any duty owed by any person or entity to someone else. Anyone using this document should rely on his or her own independent judgment or, as appropriate, seek the advice of a competent professional in determining the exercise of reasonable care in any given circumstances. The statements in this publication are for general information and represent an unaudited compilation of statistical information that could contain coding or processing errors. AGA makes no warranties, express or implied, nor representations about the accuracy of the information in the publication or its appropriateness for any given purpose or situation. This publication shall not be construed as including, advice, guidance, or recommendations to take, or not to take, any actions or decisions any matter, including without limitation relating to investments or the purchase or sale of any securities, shares or other assets of any kind. Should you take any such action or decision; you do so at your own risk. Information on the topics covered by this publication may be available from other sources, which the user may wish to consult for additional views or information not covered by this publication.
Copyright © 2023 American Gas Association