Natural Gas Market Indicators – October 31, 2023
Market Summary
The U.S. enters the winter heating season in record territory. Production, consumption, and exports are all at record highs. Pricing has returned to historical norms, as futures prices trade around $3 as winter begins. Natural gas inventories are above the five-year average, and the U.S. will likely enter the winter heating season with a 100 Bcf+ surplus above that mark. And this winter, lower natural gas heating bills are expected. The Energy Information Administration’s Winter Fuels Outlook forecasts a 21 percent reduction in average space heating expenditures for November through March.
Reported Prices
Natural gas futures have ticked higher to $3.40 per MMBtu as of October 31. Colder weather expectations and increased demand are contributing to the current pricing support. Since February, next-month contract prices had struggled to rise above $3 at Henry Hub.
Weather
The week ending October 28 saw temperatures as measured in heating degree days roughly sixteen percent warmer than last year and approximately thirty-three percent warmer than normal for the United States. All regions experienced warmer temperatures than normal, except the Pacific region. NOAA is anticipating colder-than-normal conditions in the Midwest today as a cold front pushes East through the end of the week. Forecasted temperatures are expected to drop well below normal for the U.S., bringing elevated heating demand.
Demand
Total natural gas consumption fell week-over-week from 71.6 to 70.4 for the week ending on October 25. The slight decline in consumption resulted from a 1.7 Bcf per day drop in demand from the residential and commercial sectors as warmer temperatures decreased the need for space heating. However, demand is set to increase with the upcoming colder temperatures and should push U.S. domestic consumption toward the high 80 Bcf per day range or higher as November begins.
Production
As reported by the EIA, production has remained relatively unchanged week-over-week. The EIA Natural Gas Weekly Update reports a 0.1 Bcf per day increase in production from an average of 102.5 Bcf per day to 102.6 Bcf per day. The October 18 release of the EIA’s Today in Energy projects natural gas production in the lower 48 will grow by roughly five Bcf per day in 2023, and 1.8 Bcf per day in 2024. EIA analysis anticipated most of the forecasted growth from the Permian due to expected improvement in well-level productivity. This region accounts for roughly a quarter of all natural gas production in the lower 48. EIA anticipates that production in this region alone will increase by 11 percent in 2023 and six percent in 2024.
Pipeline Imports and Exports
The EIA reports pipeline imports from Canada decreased 0.2 Bcf per day week-over-week from 5.4 to 5.2. Inversely, pipeline exports to Mexico increased an average of 0.2 Bcf per day week-over-week from 6.2 to 6.4 Bcf per day.
LNG Markets
According to the EIA’s Natural Gas Weekly Update, natural gas deliveries to U.S. LNG export terminals declined by roughly four percent week over week, from 14.3 to 13.7 Bcf per day for the week ending October 25. The EIA also reports weekly natural gas futures prices were mixed for the report week. East Asian futures at JKM increased to $18.21 per MMBtu, while European futures at the TTF fell slightly to $15.65 per MMBtu. Futures at JKM and TTF continue to price well below year-ago levels of $31.52 and $31.62 per MMBtu, respectively.
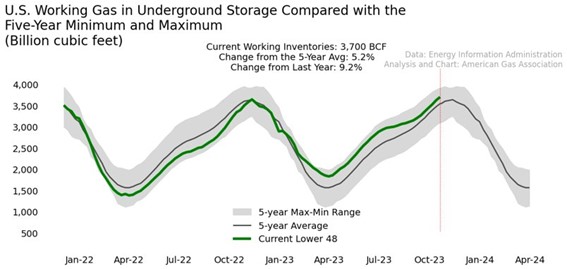
Working Gas in Underground Storage
Every region of the country shows higher-than-average underground storage inventories as we near the beginning of the typical withdrawal season. Storage stocks at 3,700 Bcf as of October 20 are 182 Bcf or 5.2 percent above the five-year average. Although storage levels are higher than the five-year average, the average rate of injections is six percent lower thus far this refill season.
Rig Count
Baker Hughes reports that the rig count in the U.S. increased slightly week-over-week with the addition of two oil-directed rigs and the removal of one gas-directed rig for the week ending October 27. The total rig count in the U.S. is 625 for this report week, a decrease of 143 rigs from the 768 rigs at the same time last year. Looking back slightly, the EIA’s October 25 edition of Today in Energy reported active natural gas rigs have declined twenty-four percent since the beginning of 2023.
For questions please contact Juan Alvarado | jalvarado@aga.org or Morgan Hoy | mhoy@aga.orgTo be added to the distribution list for this report, please notify Lucy Castaneda-Land | lcastaneda-land@aga.org
NOTICE
In issuing and making this publication available, AGA is not undertaking to render professional or other services for or on behalf of any person or entity. Nor is AGA undertaking to perform any duty owed by any person or entity to someone else. Anyone using this document should rely on his or her own independent judgment or, as appropriate, seek the advice of a competent professional in determining the exercise of reasonable care in any given circumstances. The statements in this publication are for general information and represent an unaudited compilation of statistical information that could contain coding or processing errors. AGA makes no warranties, express or implied, nor representations about the accuracy of the information in the publication or its appropriateness for any given purpose or situation. This publication shall not be construed as including, advice, guidance, or recommendations to take, or not to take, any actions or decisions any matter, including without limitation relating to investments or the purchase or sale of any securities, shares or other assets of any kind. Should you take any such action or decision; you do so at your own risk. Information on the topics covered by this publication may be available from other sources, which the user may wish to consult for additional views or information not covered by this publication.
Copyright © 2023 American Gas Association