Natural Gas Market Indicators – September 11, 2025
Natural Gas Market Summary
August brought cooler-than-normal temperatures, which helped ease demand and push natural gas prices lower. At the Henry Hub, August prompt-month prices averaged $2.89 per MMBtu, a 12.5 percent drop from July’s average price. With cooler temperatures came slightly lower demand as U.S. natural gas consumption in August came in at 77.9 Bcf per day, just 0.2 percent below July levels, with most of that decline tied to reduced power sector demand, according to Rystad Energy. Compared to August last year, domestic consumption was down 1.1 percent. However, LNG export volumes hit a record high in August.
Supply, meanwhile, tells a different story as strong production trends persist. For the month, August dry natural gas production averaged 0.1 percent above July’s levels, reflecting higher drilling levels and likely operator anticipation of growing overall demand. Supply trends have supported storage refills after reaching an 11.9 percent deficit below the five-year average in March of 2025. Inventories now sit at a 6 percent surplus relative to the five-year average and are expected to remain robust as the shoulder season unfolds and injections ramp up.
Futures Hold Near $3.00 per MMBtu
The October Henry Hub contract settled at $3.03 per MMBtu on September 10. Prices are down 1.1 percent week-over-week and have fallen 32.5 percent from the 2025-prompt-month high of $4.49 per MMBtu on March 10, according to CME data. On Thursday, September 11, intraday trading dipped below the $3 per MMBtu mark. The 12-month strip price fell week-over-week to $3.70 per MMBtu on September 19, a 0.8 percent decrease.
Argus reports the following regional spot prices for September 8:
- The Rockies and Northwest posted the highest regional spot price of the day at $2.84 per MMBtu.
- The Southwest had the lowest regional price of $1.18 per MMBtu.
- Outside these regions, prices ranged from $1.89 per MMBtu in Appalachia to $2.7 per MMBtu in the Northeast.
August Temps Coolest Since 2017
Heading into the fall shoulder season, temperatures in the U.S. have exhibited milder conditions than recent trends. For the month of August, temperatures were 9.1 percent cooler than last year according to population-weighted cooling degree days (CDDs), marking the coolest August since 2017. Temperatures for the month were 0.3 percent warmer than the 30-year normal. For the week ending September 6, temperatures in the U.S. were 22.8 percent cooler than the same week last year and 12 percent cooler than the 30-year normal.
Since May 1, cumulative daily CDDs of 1,046 were 6.1 percent lower (i.e., cooler) than the same period in 2024 and 3.5 percent lower than the 30-year normal. The National Oceanic and Atmospheric Administration’s (NOAA) near-term temperature probability outlook forecasts above-average temperatures for much of the U.S. into mid-September. In the longer term, NOAA is currently projecting total heating degree days (HDDs) from October through March to be about five percent higher than the same period last year, a difference of 167 HDDs.
To date, the Atlantic hurricane season is tracking the 31-year average, with six named storms compared to the mean of 6.3 storms, as of August 27. So far, the Atlantic has experienced one hurricane, Hurricane Erin, which impacted East Coast states from August 20 to 22. At the time of this writing, which is typically peak Hurricane season in the Atlantic, the National Hurricane Center is monitoring one disturbance with a less than 40 percent chance of cyclone formation within the next week.
Power Consumption Softens, Residential and Commercial Demand Rises
For the week ending September 11, total demand, including exports, fell 1.3 percent week-over-week and 0.1 percent year-over-year, according to preliminary data from S&P Global. Domestic demand also declined on a weekly basis (-1.2 percent) and remained below last year’s levels (-4.1 percent). Weekly losses were concentrated in the electric power sector, falling 5.2 percent. In contrast, demand in the residential/commercial and industrial sectors increased over last week’s levels, rising by 12.4 percent and 0.6 percent, respectively. Year-over-year domestic consumption is down 4.1 percent, primarily driven by a 9 percent decrease in electric power consumption.
Lower year-over-year natural gas demand for electric power has characterized the summer of 2025. Data from Rystad Energy show that, as of September 6, year-to-date daily power gas consumption averaged 37.3 Bcf per day, 2.9 percent below the same period in 2024, and natural gas demand for May through September 6 fell 3.7 percent from last year’s levels for the same period. This reduction reflects two primary factors: cooler temperatures than in 2024 and a 3.7 percent reduction in the share of natural gas used for power generation relative to the same period last year, partly driven by gas-to-coal switching.
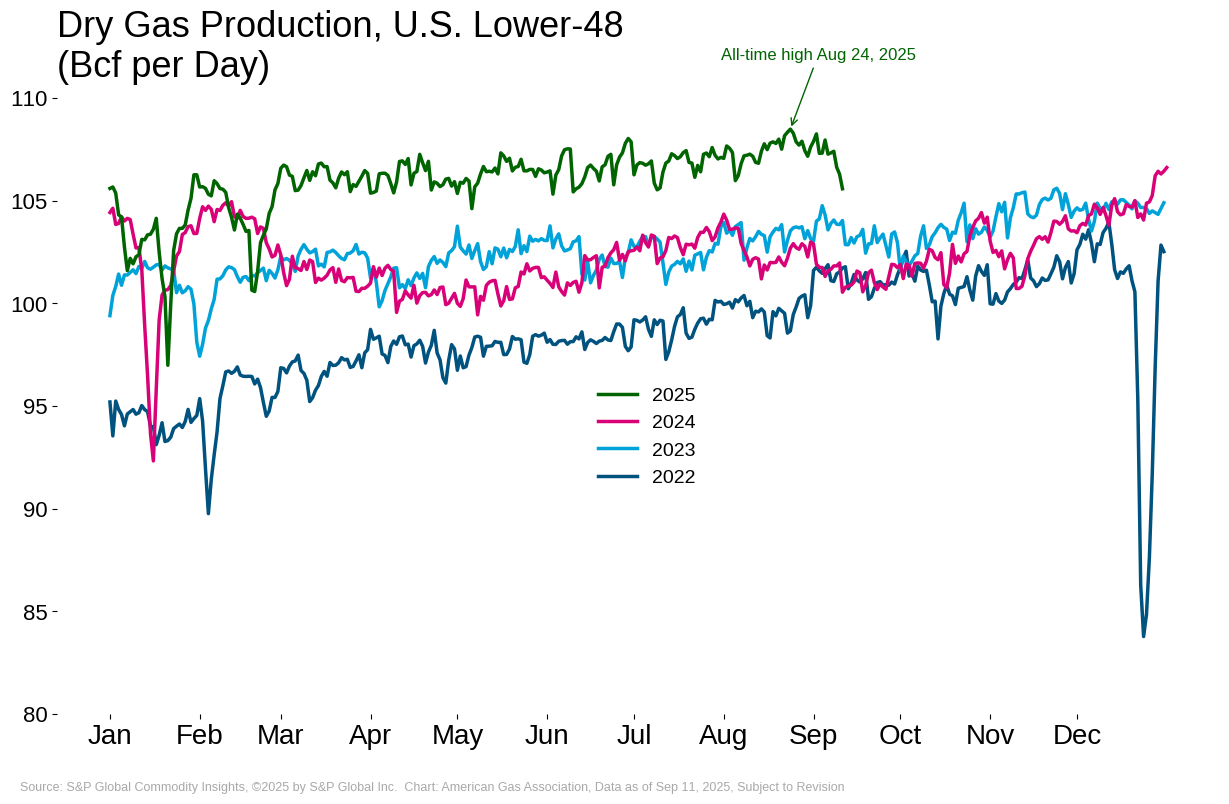
Dry Natural Gas Production Remains Strong
For the month of August, production averaged 108.7 Bcf per day, 0.1 percent higher than the July average and 0.3 percent lower than the all-time monthly high set in June 2025, according to Rystad Energy. Into early September, dry natural gas production for the week ending September 11 is 0.6 percent lower than the prior week, according to preliminary data from S&P Global. Compared to last year, production is up 5.4 percent. In its September Short-Term Energy Outlook (STEO), the Energy Information Administration (EIA) revised its 2025 natural gas production growth estimate upward by 0.1 percentage points.
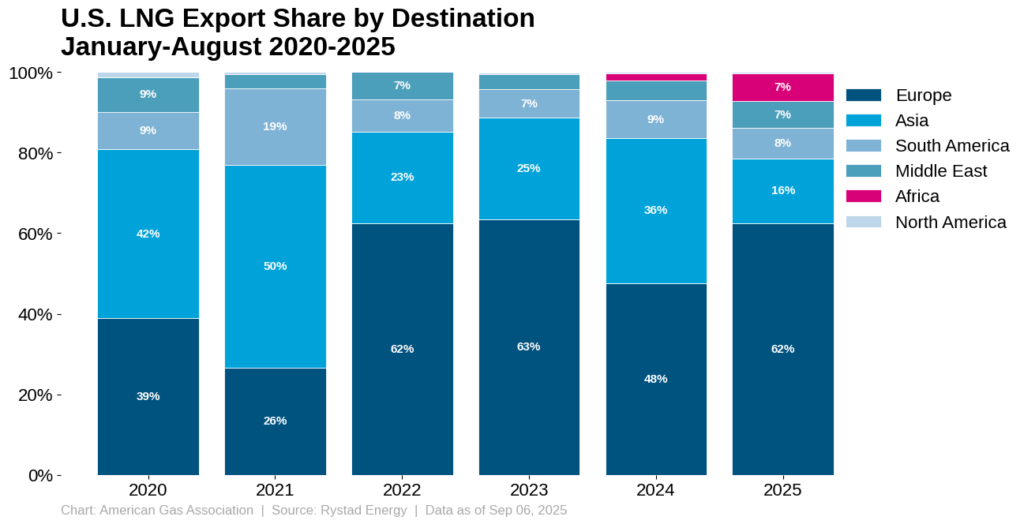
U.S. LNG Market Expands in Africa
From August 28 through September 3, 26 LNG vessels with a combined carrying capacity of 100 Bcf departed the U.S., according to Bloomberg Finance, L.P. shipping data reported by the EIA. Half of these vessels departed from Sabine Pass (eight tankers) or Plaquemines (five tankers). Compared to the previous week, two fewer ships departed the U.S., reducing carrying capacity by 6 Bcf. Rystad Energy data indicates that average daily LNG exports are up 6.9 percent year-to-date through August 31 compared to the same period in 2024. By destination, U.S. LNG exports to Africa, the Middle East, and North America have all increased, while exports to Asia and South America have declined. Europe remains the largest market for U.S. LNG, accounting for 62.5 percent of total exports to date in 2025, or about 7.6 Bcf per day. Asia holds the second largest share at 16.1 percent, while Africa’s share has risen notably from 1.9 percent year-to-date in 2024 to 6.9 percent in 2025.
LNG feedgas flows remain strong, supporting market growth. Most recently, data from Rystad Energy reports that deliveries to terminals decreased by 0.4 percent over last year but are up 17.89 percent over the same week in 2024 for the week ending September 10.
Pipeline Flows Mixed in Early September
Natural gas pipeline imports from Canada were 4.2 percent higher week-over-week but lagged last year by nearly 17 percent for the week ending September 11, according to preliminary data from S&P Global. By comparison, pipeline exports to Mexico were down 4.4 percent week-over-week but exceeded flows for the same period last year by 3.4 percent.
Natural Gas Rig Count Remains Strong Year-Over-Year
According to Baker Hughes, the total number of rigs in the U.S. increased by one to 537 for the week ending September 5. Compared to last year, the total number of rigs is down 7.7 percent. Year-over-year, the reduction is driven by the number of oil rigs, which fell by 69 or 14.3 percent. By comparison, the number of gas rigs is up 24 to 118 rigs compared to last year, an increase of more than 25 percent.
For the week ending September 5:
- The number of oil rigs increased by 2, a change of 0.5 percent.
- The number of gas rigs declined by one, a change of 0.8 percent.
Total Working Gas Stock Near Year-Ago Levels
For the week ending September 5, the EIA reports a net injection of 71 Bcf into underground storage facilities in the lower 48, raising total working gas inventories to 3,343 Bcf. Working gas stocks now sit 6 percent above the five-year average and 1.1 percent below year-ago levels. Week-over-week, the injections were strongest in the Midwest, rising 3.5 percent, while the Pacific region experienced a net withdrawal of 0.1 percent. In every region, storage inventories remain above the 5-year average, with surpluses ranging from 0.2 percent in the Midwest to 20.7 percent in the Mountain region.
In its September STEO, the EIA projects a faster-than-typical withdrawal forecast from underground storage inventories, which is expected to put upward pressure on natural gas prices. However, despite an anticipated colder winter, the EIA’s revised forecast predicts storage inventories could be 1 percent above the five-year average at the end of March 2026.
What to Watch:
- Storage: As of September 5, inventory levels in the Midwest, Mountain, and East regions remain below the five-year average. With winter approaching, to what extent can these deficits be reduced during the shoulder season?
- Weather: The Atlantic hurricane season has had a relatively quiet start. As the U.S. enters the historical peak period, could this trend shift and how might that impact Gulf Coast production?
- LNG: With new export capacity ramping up and the peak demand season approaching, will LNG exports continue to break records this winter?
For questions please contact Juan Alvarado | jalvarado@aga.org, Liz Pardue | lpardue@aga.org, or
Lauren Scott | lscott@aga.org
To be added to the distribution list for this report, please notify Lucy Castaneda-Land | lcastaneda-land@aga.org
NOTICE
In issuing and making this publication available, AGA is not undertaking to render professional or other services for or on behalf of any person or entity. Nor is AGA undertaking to perform any duty owed by any person or entity to someone else. Anyone using this document should rely on his or her own independent judgment or, as appropriate, seek the advice of a competent professional in determining the exercise of reasonable care in any given circumstances. The statements in this publication are for general information and represent an unaudited compilation of statistical information that could contain coding or processing errors. AGA makes no warranties, express or implied, nor representations about the accuracy of the information in the publication or its appropriateness for any given purpose or situation. This publication shall not be construed as including advice, guidance, or recommendations to take, or not to take, any actions or decisions regarding any matter, including, without limitation, relating to investments or the purchase or sale of any securities, shares or other assets of any kind. Should you take any such action or decision; you do so at your own risk. Information on the topics covered by this publication may be available from other sources, which the user may wish to consult for additional views or information not covered by this publication.
Copyright © 2025 American Gas Association. All rights reserved.Natural Gas Market Indicators – June 6, 2025