Natural Gas Market Indicators – September 25, 2025
Natural Gas Market Summary
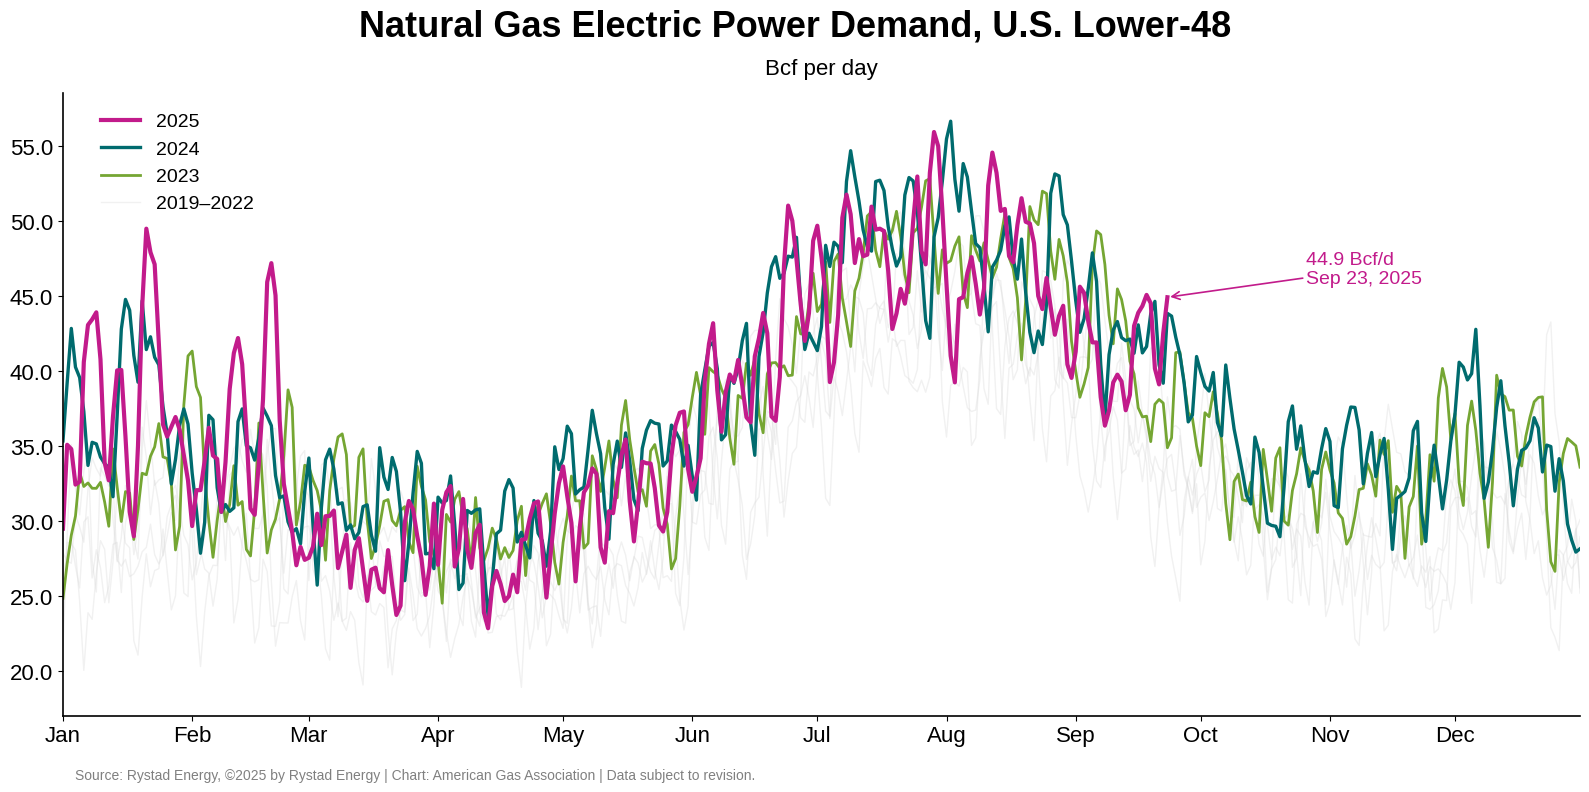
Autumn has officially arrived, ushering in the final weeks of the fall shoulder season before the winter heating season begins on November 1. Despite milder temperatures in August and September, total natural gas demand, including domestic end uses and exports, remains at record levels, measuring 3.2 percent higher year-to-date through September 24, according to preliminary data from S&P Global Commodity Insights (S&P Global). However, natural gas demand in the electric power sector is nearly 3 percent lower year-to-date through September 22, according to data from Rystad Energy, coinciding with milder temperatures and the commodity price uplift from 2024. Looking at supplies, natural gas production is up 4.4 percent to 107.3 Bcf per day, with new monthly production records set in the Eagle Ford play and Permian Basin in July and Appalachian Basin in August, according to Rystad. Underground storage inventories are up 6.1 percent from the five-year average and above year-ago levels for the first time this year.
Henry Hub Futures Under $3/MMBtu for Five Consecutive Sessions
The Henry Hub prompt month settled at $2.86 per MMBtu on September 24 as the October 2025 contract nears expiry. According to CME data, the prompt month price is down nearly 8 percent week-over-week and 5 percent below settlement on September 2. Intraday on Thursday, prompt month prices moved toward $3 per MMBtu. By comparison, the 12-month strip settled at $3.6 per MMBtu on September 24, down 4.2 percent week-over-week and nearly 3 percent since early September.
Argus reports the following regional spot prices for September 23:
- Louisiana and the Southeast posted the highest regional spot price for the day of $2.92 per MMBtu.
- The Southwest had the lowest regional price of $1.37 per MMBtu.
- Prices in other U.S. regions ranged from $1.75 per MMBtu in Appalachia to $2.70 per MMBtu in East Texas.
Milder Temps May Be Changing into Early October
Milder-than-normal temperatures continued into September. Through September 23, temperatures this month have been the coolest since 2009, according to population-weighted CDDs published by the National Oceanic and Atmospheric Administration (NOAA). For the week ending September 20, however, temperatures across the U.S. were 6.7 percent warmer than last year and 41.2 percent warmer than the 30-year normal. Into early October, NOAA predicts above-normal temperature trends for the majority of the U.S., with portions of Alaska and the Aleutian Islands expected to be near normal. The northern Midwest has the highest probability of above-normal temperatures in the 70 to 80 percent range.
In the Atlantic, NOAA’s National Hurricane Center (NHC) is tracking Hurricane Gabrielle, Tropical Storm Humberto, and a disturbance with a greater than 60 percent chance of cyclone formation over the next week. At publication, Gabrielle is currently moving east-northeast across the North Atlantic, which could cause swells along the Atlantic Coast in the northeastern U.S. and into Canada. Meanwhile, Humberto is moving northwest and is expected to become a hurricane by the weekend. As of 11AM EST on Thursday, the NHC reported Humberto’s maximum sustained winds have increased to 50 MPH.
Domestic Consumption Up for the Week, Lower Year-over-Year
Total demand, including exports, rose 1.6 percent week-over-week and 1.3 percent compared to last year for the week ending September 25, according to preliminary data from S&P Global. Domestic consumption rose 1.1 percent compared to the previous week but slid 3.8 percent compared to year-ago levels. Residential and commercial sector demand rose 0.8 percent week-over-week, while industrial sector demand grew 0.2 percent. Compared to the same period last year, residential and commercial sector demand for the week fell 3.2 percent.
Rystad Energy data suggests that natural gas demand in the electric power sector averaged 43 Bcf per day for the week ending September 23, up 7 percent week-over-week. Compared to the same week last year, power sector demand rose 2 percent.
Eagle Ford and Permian Basins Expected to Drive 2025 Annual Production Growth
Natural gas production has remained strong for the year to date. Data from Rystad Energy suggest that output averaged 107.3 Bcf per day between January and August, a 4.5 Bcf per day increase over 2024 levels. By year-end, production is forecast to reach 107.7 Bcf per day, an increase of 4.4 percent over 2024.
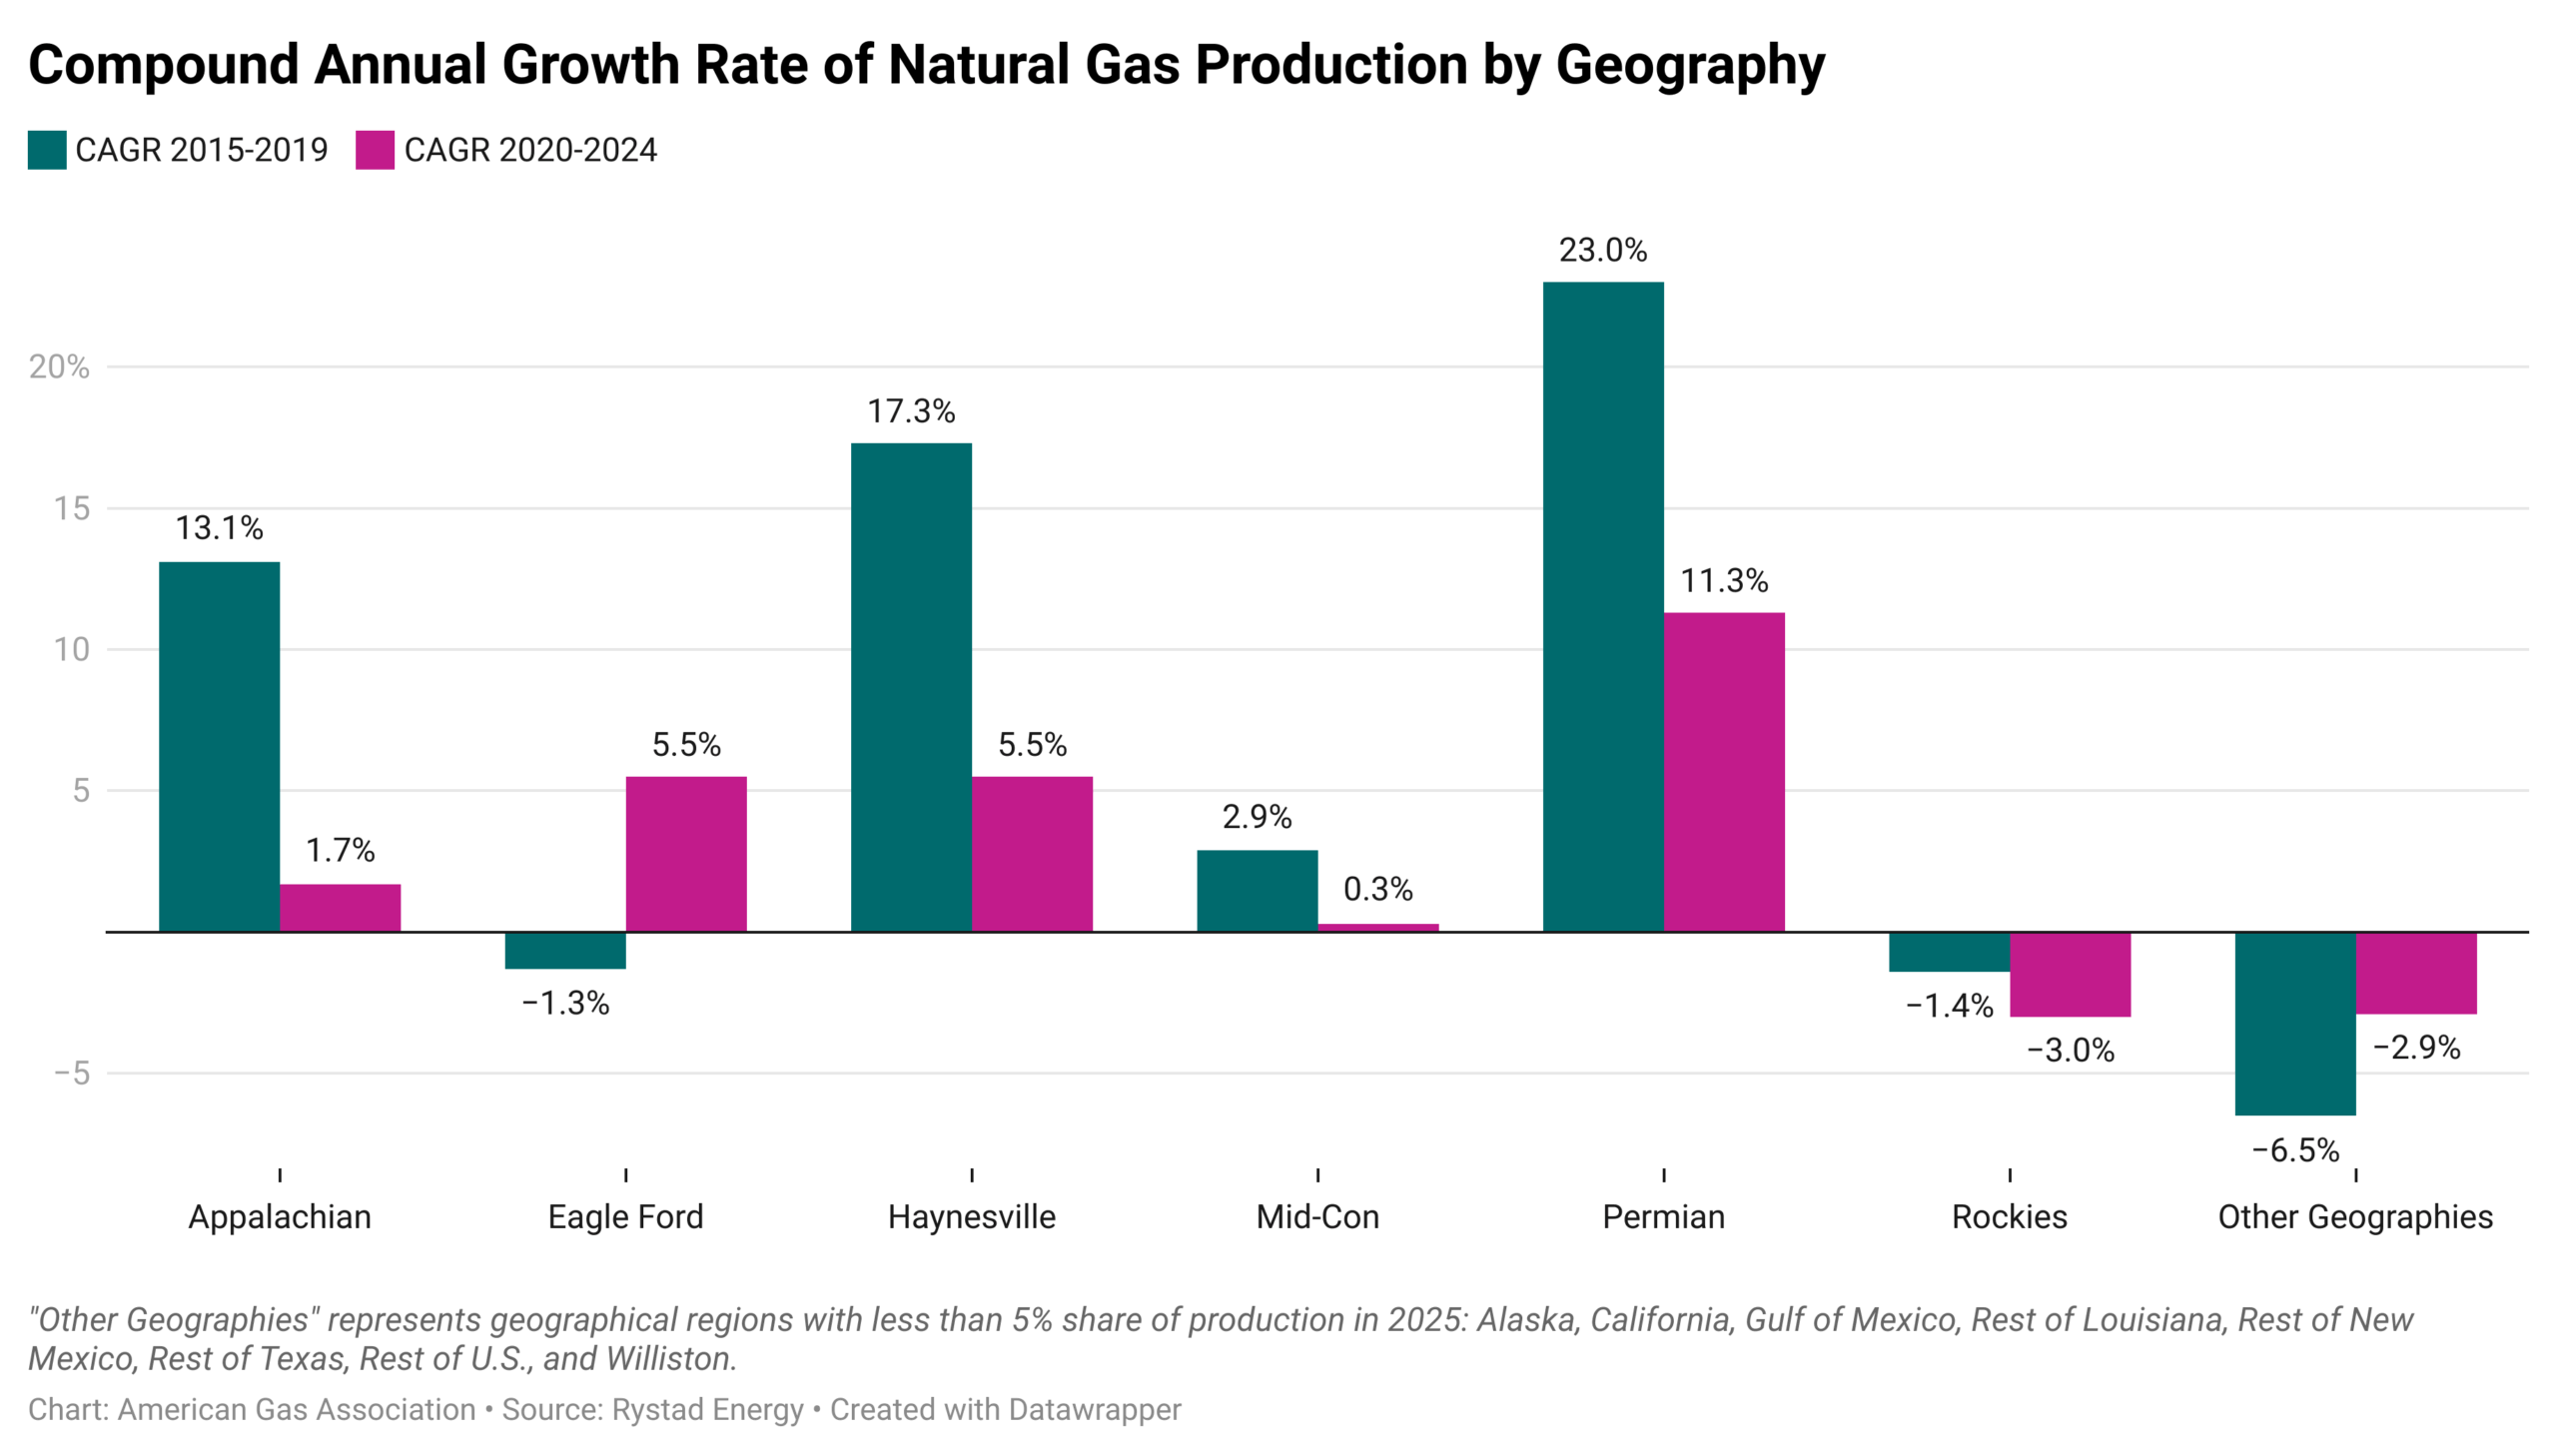
Rising output from the Eagle Ford play and Permian Basin has largely driven U.S. production gains in 2025. Year-to-date through August, Eagle Ford and Permian production levels have increased 7.8 percent and 10.3 percent, respectively, over the previous year. Other year-to-date gains between 0.7 percent and 5.9 percent have been realized in Appalachian, Haynesville, Mid-Continent, Rockies, and New Mexico-area geographies. On a Compound Annual Growth Rate (CAGR) basis, the Permian Basin has exhibited the most natural gas production growth over two recent five-year periods: 23 percent from 2015 to 2019 and 11.3 percent from 2020 to 2024. The Haynesville play and the Appalachian Basin each reported double-digit growth from 2015 to 2019, while the CAGR for Eagle Ford and Haynesville had the second-highest growth in the 2020 to 2024 period.
New LNG Export Facility Reaches Final Investment Decision
The number of LNG vessels departing the U.S. during the week ending September 17 fell to 24 over the prior week, according to Bloomberg Finance, L.P. shipping data reported by the EIA. Total carrying capacity fell week-over-week by 37 Bcf to 92 Bcf. This decline is partly driven by annual maintenance at Cove Point, which exported no vessels for the week after shipping two the week prior. Although lower than the previous week, the trend of vessels departing the U.S. has remained stable since at least early April.
From the perspective of LNG feedgas, deliveries for the week ending September 24 averaged 15.7 Bcf per day, according to Rystad Energy, down 0.7 percent week-over-week. Compared to the same week in 2024, feedgas flows are up more than 27 percent. On September 23, Sempra announced it had reached the final investment decision for its Port Arthur LNG Phase 2 facility in Texas. The 13 million tonnes per annum facility will be located in Texas and is expected to begin commercial operations in 2030.
Short-Term Pipeline Flows Up for the Week
According to preliminary data from S&P Global, weekly natural gas pipeline imports from Canada and exports to Mexico increased 1.2 percent and 10.1 percent, respectively, for the week ending September 25. Compared to the same period last year, exports to Mexico remained positive, up 2 percent, but imports from Canada fell 13.6 percent.
Natural Gas Rig Count Flat Week-over-Week, Higher than Last Year
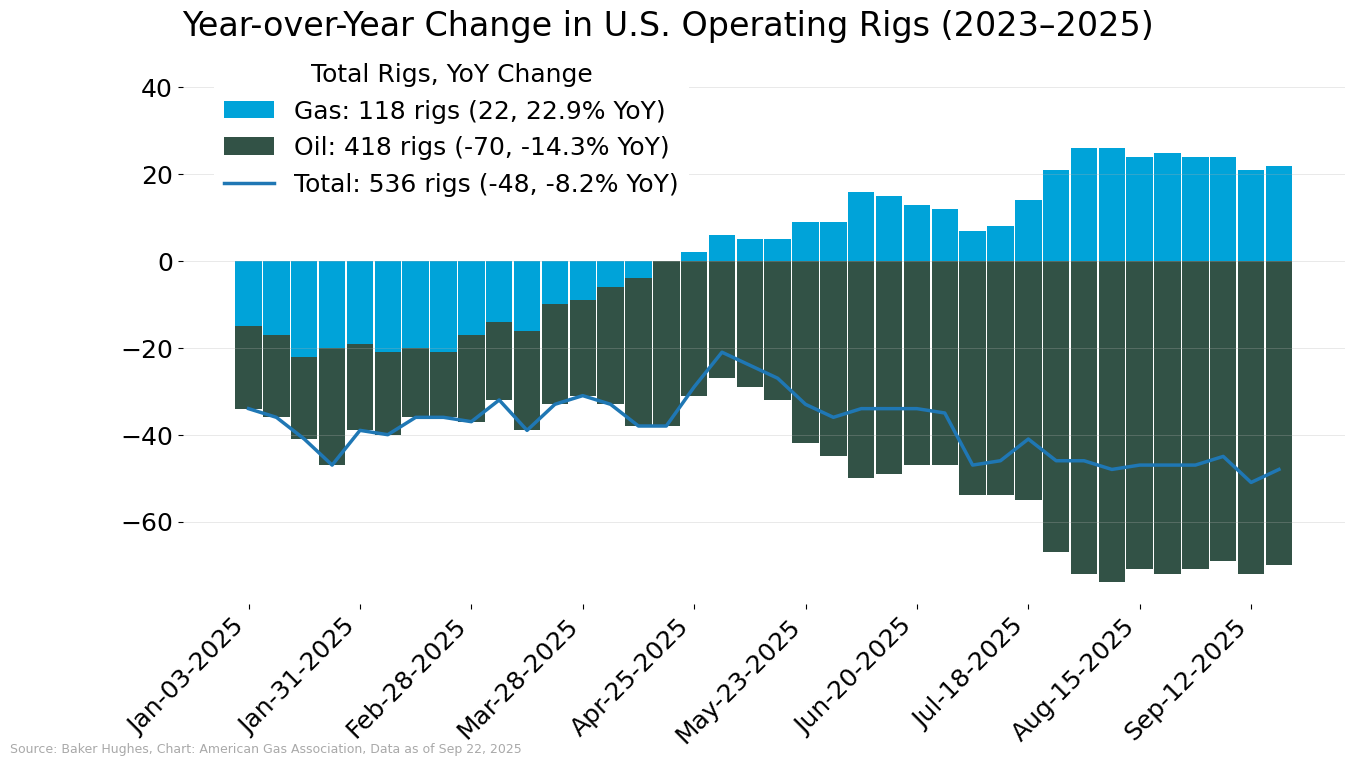
The number of natural gas rigs continues to climb year-over-year while oil rig counts fall, according to Baker Hughes. For the week ending September 19, the number of natural gas rigs remained flat at 118, but 23 percent higher than last year. By comparison, the oil rig count increased by two for the week but remains more than 14 percent lower year-over-year. The number of rigs in the U.S., including miscellaneous rigs, totaled 542 for the week, nearly 8 percent lower than year-ago levels.
Working Gas Stock Above Year-Ago Levels for First Time in 2025
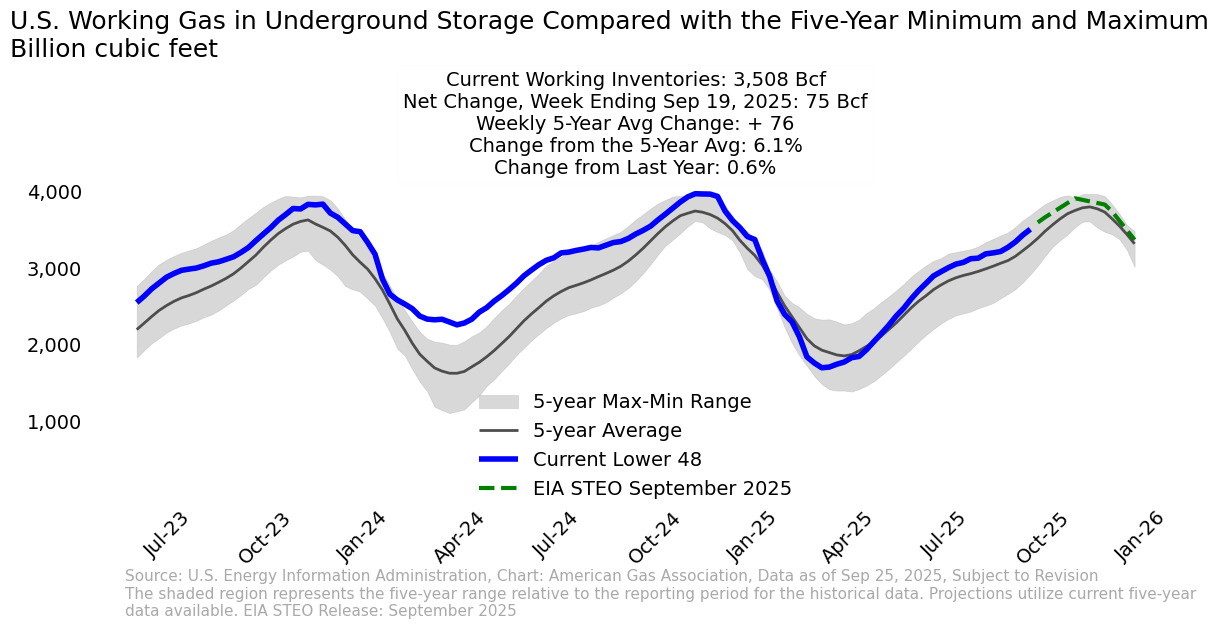
A 203 Bcf net injection for the week ending September 19 pushed lower 48 working gas inventories above 3.5 Tcf, according to the EIA. Stores are now 6.1 percent over the five-year average and 0.6 percent above year-ago levels, marking the first positive year-over-year reading of 2025.
Regionally for the week:
- Inventories in all regions are at or above the five-year average, with the Mountain region having the largest surplus of 20.4 percent.
- The Pacific and South Central are the only regions with storage in excess of year-ago levels. Surpluses are 4.2 percent and 6.9 percent, respectively.
- Regions with deficits to prior year levels range from -4.5 percent in the Midwest to -1.1 percent in the East.
What to Watch:
- LNG: Vessels departing the U.S. dipped week-over-week in mid-September, yet LNG feedgas deliveries remain strong. How might U.S. LNG export volumes trend for the remainder of 2025?
- Weather: With an increased chance of above-normal temperatures into early October, what could be the impact on underground storage refills as the winter heating season nears?
- Production: Will production gain forecasts into 2026 continue to support year-over-year growth in natural gas rig counts?
For questions please contact Juan Alvarado | jalvarado@aga.org, Liz Pardue | lpardue@aga.org, or
Lauren Scott | lscott@aga.org
To be added to the distribution list for this report, please notify Lucy Castaneda-Land | lcastaneda-land@aga.org
NOTICE
In issuing and making this publication available, AGA is not undertaking to render professional or other services for or on behalf of any person or entity. Nor is AGA undertaking to perform any duty owed by any person or entity to someone else. Anyone using this document should rely on his or her own independent judgment or, as appropriate, seek the advice of a competent professional in determining the exercise of reasonable care in any given circumstances. The statements in this publication are for general information and represent an unaudited compilation of statistical information that could contain coding or processing errors. AGA makes no warranties, express or implied, nor representations about the accuracy of the information in the publication or its appropriateness for any given purpose or situation. This publication shall not be construed as including advice, guidance, or recommendations to take, or not to take, any actions or decisions regarding any matter, including, without limitation, relating to investments or the purchase or sale of any securities, shares or other assets of any kind. Should you take any such action or decision; you do so at your own risk. Information on the topics covered by this publication may be available from other sources, which the user may wish to consult for additional views or information not covered by this publication.
Copyright © 2025 American Gas Association. All rights reserved.Natural Gas Market Indicators – June 6, 2025