Breakdown of a Residential Natural Gas Bill
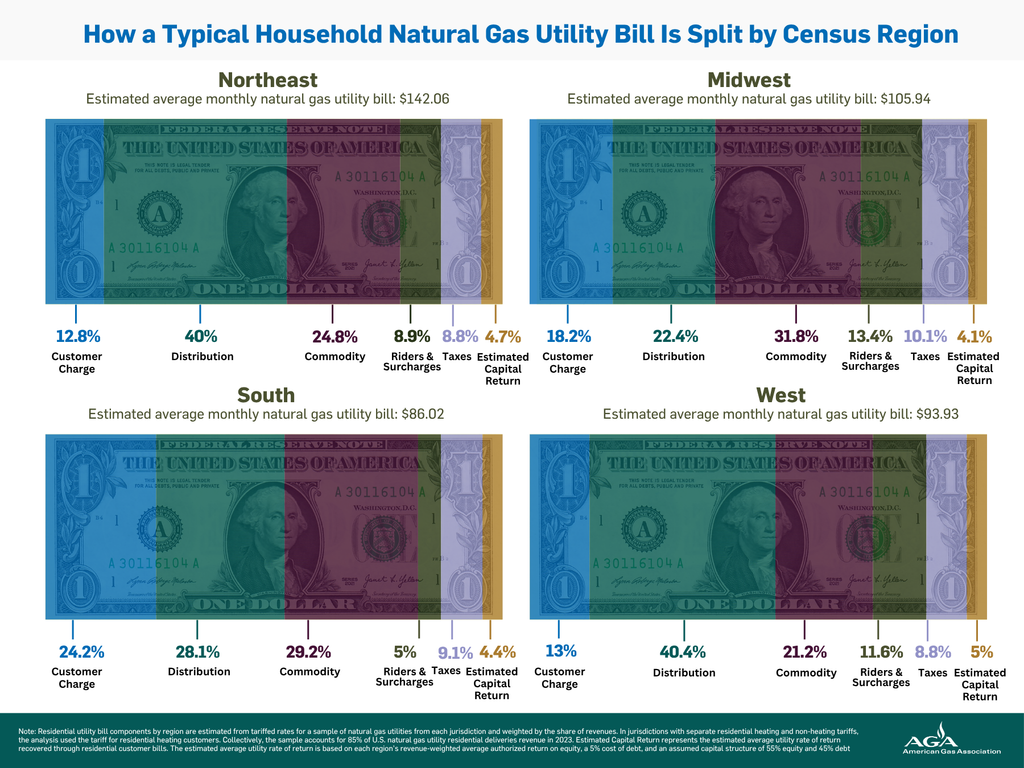
As stakeholders and policymakers discuss utility costs, consumer bills, and the role of authorized utility returns, this Energy Insight breaks down the residential natural gas bill to show how many cents of every dollar paid by customers are attributable to commodity costs, delivery charges, taxes, policy riders, and surcharges, and utility returns. In every region of the country, the utility’s return on invested capital represents the smallest slice of the bill. Policy riders, surcharges, and taxes together can be comparable to the cost of the commodity itself.
For this analysis, AGA reviewed residential tariffs for the three largest natural gas utilities—excluding municipally owned utilities—in every U.S. state and the District of Columbia. The utilities included in this analysis account for 85% of U.S. residential natural gas delivery revenue. Tariffs reviewed are those in effect as of April 1, 2026, and the results are weighted by utility revenue based on 2023 residential deliveries. In jurisdictions with separate residential heating and non-heating tariffs, the analysis used the heating tariff. The findings below break the bill down by component, followed by data, methods, and additional illustrative scenarios.
Key Findings
- The estimated capital return makes up less than 5% of the residential natural gas bill for the average U.S. customer. This component reflects the portion of bills associated with the utility’s authorized weighted average cost of capital, including both debt and equity returns.
- Commodity costs make up about one-quarter of the average residential natural gas bill. This portion is passed through directly to customers, and utilities earn no return on it.
- Distribution charges and fixed customer charges are a major share of the bill. About 33 cents out of every dollar paid by the average residential natural gas customer in the U.S. pays for the cost of delivering gas to the customer. These are the day-to-day costs of running a safe and reliable distribution system.
- The share of each residential bill attributable to policy riders and surcharges varies by region. They account for as little as 5% of the average bill in the South and as much as 13.4% in the Midwest. Riders and surcharges fund regulatory and legislatively mandated programs, such as energy efficiency, environmental remediation, and storm recovery.
- Taxes make up about 9% of the average residential natural gas bill. These charges reflect state and local taxes applied to utility service and are not set by the utility.
- Policy riders, surcharges, and taxes together are roughly three to six times the estimated capital return component recovered through residential bills. The estimated capital return—which includes both debt and equity costs—is the smallest portion of the estimated residential gas bills. As such, the equity portion of the estimated capital return represents one of the smallest elements of the average customer bill.
- Even meaningful reductions in authorized returns would lower the typical residential bill by only about $0.80 to $1.50 per month, all else being equal. Because the estimated capital return component accounts for the smallest portion of the average bill in every region, the potential savings from reducing allowed returns would be small and bounded. Proposals to reduce authorized returns should therefore be weighed against the full customer bill, and against the risk that lower returns might raise the overall cost of equity or discourage the investment that keeps the system safe and reliable.
Methods and Discussion
All data has been compiled from publicly available individual utility tariffs for residential classes and aggregated into state and regional data and weighted by the share of residential revenues. The categories collected and reported include:
- Customer charge – the average tariffed customer charge for residential customers in effect as of April 1, 2026. The customer charge is a fixed monthly fee designed to recover the basic costs of providing service. It generally reflects the fixed portion of the utility’s revenue requirement, as determined through a cost-of-service study, and includes operating expenses, depreciation, certain taxes, and capital investments needed to provide utility service.
- Distribution – the average tariffed distribution charge for residential customers in effect as of April 1, 2026, multiplied by the average residential consumption in that state, as reported on EIA Form 176. The distribution charge is a volumetric fee designed to recover the costs to provide utility service per therm. It generally reflects the variable portion of the utility’s revenue requirement, as determined through a cost-of-service study, and includes operating expenses, depreciation, certain taxes, and capital investments needed to provide utility service.
- Cost of Gas – the prior 12-month average commodity price charged to residential customers as of April 1, 2026. These prices are sourced from the utility’s tariff or from information published on its website. This cost is strictly pass-through. The utility does not earn a return on the commodity.
- Policy riders and surcharges – all standalone, temporary charges billed to residential customers for regulatory or legislatively mandated programs that are not recovered through base rates, excluding commodity-related riders. Some of the costs recovered through riders include storm recovery, energy efficiency, environmental cleanup, and other programs.
- Taxes – all monthly taxes charged to residential customers. In jurisdictions with varying franchise or municipal tax rates, an average tax rate is used. Taxes are strictly passed through. The utility does not earn a return on taxes.
- Estimated Capital Return – the estimated average utility rate of return that is recovered through residential customer bills and is based on the weighted-average return on equity for each region, a 5% cost of debt, and an assumed capital structure of 55% equity and 45% debt. The figures shown are based on authorized ROEs. For utilities that do not consistently earn their authorized ROE, these figures likely overstate actual profit.
Scenario Analysis
To illustrate the impact of alternative financing assumptions, AGA recalculated the estimated capital-return portion of the residential bill under three illustrative weighted-average cost of capital scenarios compared to the baseline, while holding the tariffed customer charge, distribution charge, and policy riders and surcharges constant. Commodity costs and taxes are excluded from the sensitivity analysis, as they are pass-through items that do not generate a return on investment.
The results show that residential bills are only modestly sensitive to changes in assumed capital costs because the estimated capital return is the smallest component of the total bill. The baseline scenario applies the same assumptions used to estimate the capital-return component of the bill, specifically a capital structure with 55% equity and 45% debt and a 5.0% cost of debt, paired with the national weighted-average authorized ROE of 9.77%, resulting in a weighted-average cost of capital (WACC) of 7.62%. Under the scenario with a lower ROE, a smaller share of equity, and a lower cost of debt (Scenario 3), the estimated monthly bill falls by $0.80 to $1.50 compared with the baseline. Under the scenario with greater leverage and higher costs of debt and equity (Scenario 2), monthly bills rise by $0.57 to $0.92. Even with a sharp shift toward debt financing at unchanged debt costs and higher equity costs (Scenario 1), bills only fall by $0.54 to $1.05 per month.
These scenarios are illustrative and should not be read as mechanical bill-saving estimates. In practice, capital structure, debt costs, and allowed returns are connected. If utility investment is perceived as riskier, or if utilities are pushed toward higher leverage, lenders and investors may require higher returns, which could reduce or eliminate the expected customer savings from a lower assumed WACC. Lower authorized returns could therefore raise the cost of capital or disincentivize investment in the system—with potential impacts on reliability, safety, and access—while delivering minimal, if any, realized savings on consumers’ bills.
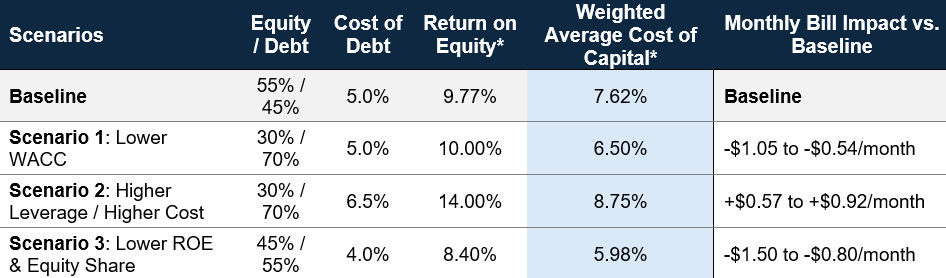
Notes: Weighted Average Cost of Capital (WACC) is calculated as equity share × return on equity (ROE) plus debt share × cost of debt. Estimated impacts on monthly bills reflect only changes to the estimated capital-return component of the residential bill. These results are illustrative and use standardized assumptions. Actual utility capital structures, authorized ROEs, debt costs, and earned returns vary by jurisdiction and company. In practice, these inputs are not independent: if utility investment becomes riskier or capital structures become more leveraged, debt costs and required equity returns may rise, reducing or eliminating expected customer savings.
*The baseline scenario reflects the national weighted-average authorized ROE and resulting WACC. The alternative scenarios are hypothetical and therefore use assumed ROEs for illustrative comparison.
For questions, please contact Juan Alvarado | jalvarado@aga.org or Liz Pardue | lpardue@aga.org
In issuing and making this publication available, AGA is not undertaking to render professional or other services for or on behalf of any person or entity. Nor is AGA undertaking to perform any duty owed by any person or entity to someone else. Anyone using this document should rely on his or her own independent judgment or, as appropriate, seek the advice of a competent professional in determining the exercise of reasonable care in any given circumstances. The statements in this publication are for general information and represent an unaudited compilation of statistical information that could contain coding or processing errors. AGA makes no warranties, express or implied, nor representations about the accuracy of the information in the publication or its appropriateness for any given purpose or situation. This publication shall not be construed as including advice, guidance, or recommendations to take, or not to take, regarding any matter, including without limitation relating to investments or the purchase or sale of any securities, shares or other assets of any kind. Should you take any such action or decision; you do so at your own risk. Information on the topics covered by this publication may be available from other sources, which the user may wish to consult for additional views or information not covered by this publication.
Copyright © 2026 American Gas Association. All rights reserved