Natural Gas Market Indicators – April 16, 2026
Natural Gas Market Summary
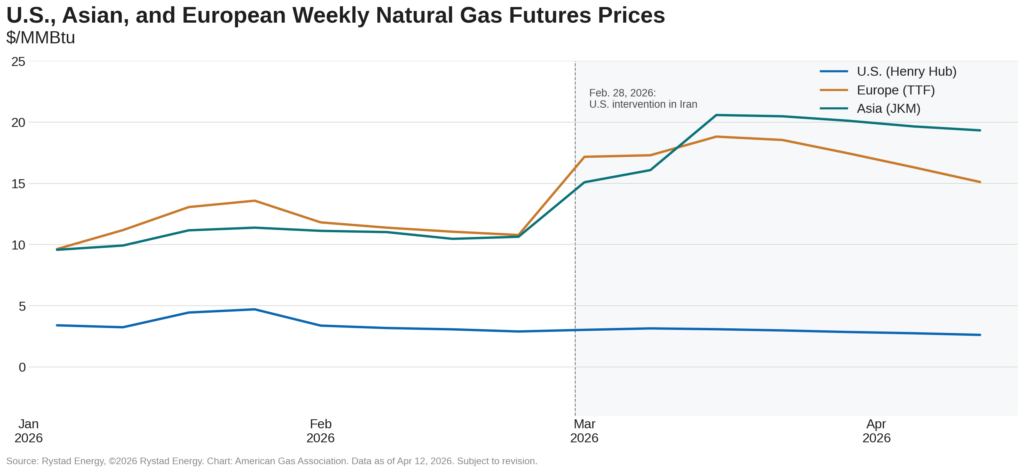
The natural gas market is in a brief seasonal lull as mild shoulder-season temperatures dampen domestic demand, support stronger storage refills, and reduce upward pressure on Henry Hub prices. Prompt-month futures fell to a five-month low of $2.63 per MMBtu on April 13, while global markets experience price elevation as geopolitical uncertainty continues. Futures prices at Europe’s key trading hub, the Dutch Title Transfer Facility (TTF), and Asia’s benchmark, the Japan Korea Marker (JKM), have risen roughly 48.1 percent and 82.8 percent, respectively, since the conflict in Iran began at the end of February 2026, according to data from Rystad Energy. Over the same period, Henry Hub prices declined 9.1 percent. Despite muted domestic prices, global prices continue to support production trends, with output up 3.4 percent year-to-date. As summer approaches, supply-demand dynamics will remain a critical driver of commodity prices.
Prompt Month Prices Reach 5-Month Low
Henry Hub prompt month futures prices remain below $3.00 per MMBtu after falling to $2.89 per MMBtu on March 23, ahead of the rollover from the April to May front-month contract. With strong year-to-date production and well-supplied storage inventories, bearish trends have persisted into mid-April, with prompt-month prices reaching a five-month low of $2.60 per MMBtu on April 14.
Looking ahead, the 12-month Henry Hub futures strip indicates that U.S. prices may edge higher, though they are expected to remain relatively subdued. On April 14, 12-month forward settlements averaged $3.36 per MMBtu, their lowest level since January 16, 2026, prior to Winter Storm Fern.
Echoing this sentiment, the Energy Information Administration’s (EIA) April Short Term Energy Outlook (STEO) projects that robust storage inventories will act as a supply cushion in the near-term, keeping Henry Hub spot prices close to seasonal norms of about $3.10 per MMBtu through both the second and third quarters of 2026.
Mild Shoulder Season Conditions
Heating and cooling demand remain muted in mid-April, as spring continues to bring milder temperatures across the lower 48. Looking ahead, National Oceanic and Atmospheric Administration’s (NOAA) 8-to-14-day Outlook into late April favors above-normal temperatures across much of the central, southern, and eastern U.S., with the highest probability for warmer than normal temperatures centered on the Gulf Coast and Southeast. NOAA expects below-normal temperatures in parts of Northwest Alaska, while portions of the Southwest, Upper Midwest, and Northeast lean near-normal.
Demand Declines Despite Strong Exports
Total natural gas demand, including exports, is down 1.7 percent month-to-date through April 16 compared with the same period last year, according to preliminary data from S&P Global Energy. The decline has occurred despite increasing exports and electric power demand. A decrease in residential and commercial demand of 28.7 percent, coupled with a decline in industrial demand of 2.1 percent year over year, have more than offset an increase in total exports of 10.5 percent and an increase in electric power demand of 9.2 percent year-over-year. Year-to-date, average daily total demand remains flat.
Production Falls but Remains Above April 2025 Levels
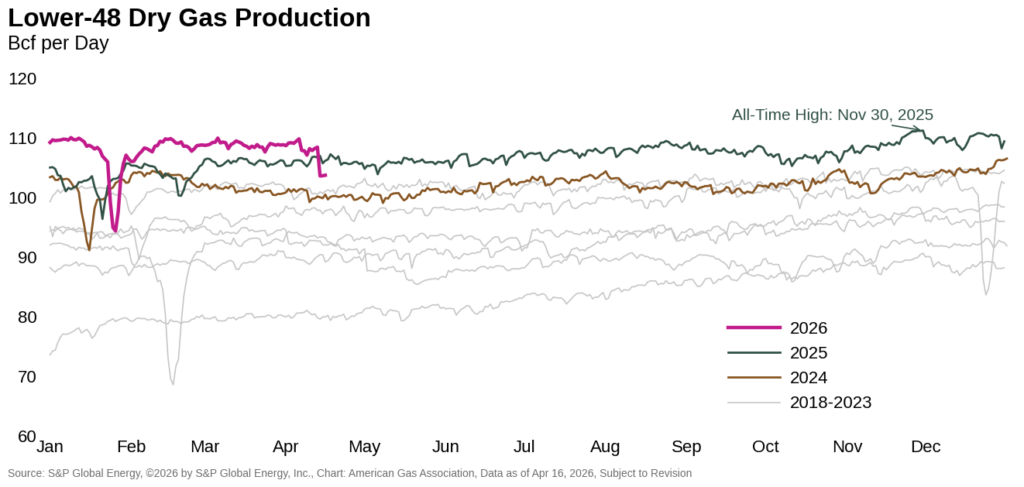
Dry natural gas production in the lower 48 has declined modestly so far in April. As of April 16, preliminary data from S&P Global Energy suggest that production is 1.3 percent lower than the same period in March and 4.6 percent lower than at the start of the month. The decline may reflect weaker domestic consumption, which lowers production incentives. Rig counts have mirrored this trend, with a reduction in gas-directed rig totals from March to April. Despite the recent slowdown in output, month-to-date production remains 1.5 percent higher than in 2025, suggesting that global pricing signals continue to support strong output in the near term.
LNG Feedgas Remains Strong
LNG feedgas deliveries averaged 19.0 Bcf for the week ending April 15, remaining flat week-over-week, but rising 13.7 percent over the same period last year, according to preliminary data from Rystad Energy. Year to date, feedgas volumes are running more than 20 percent higher as new liquefaction facilities come online and global demand for U.S. LNG increases.
Globally, Rystad Energy reports that Qatar has begun initial steps to restart LNG production at the Ras Laffan complex following the recent U.S.-Iran ceasefire, with limited output potentially resuming in the near term. The pace of recovery remains uncertain, with safe transit through the Strait of Hormuz continuing to be a key constraint on exports.
Even if the strait reopens, NPR reports that a return to full Qatari production capacity could take years. It also remains unclear when Qatar LNG cargoes could again reach buyers in Asia and Europe, prolonging the global shortage of natural gas. As a result, attention remains on the U.S. benchmark to help fill the gap, with shares of several U.S.-based LNG companies rising 20 to 30 percent since the start of the war.
Storage Projected to Temper Spot Prices into Q3 of 2026
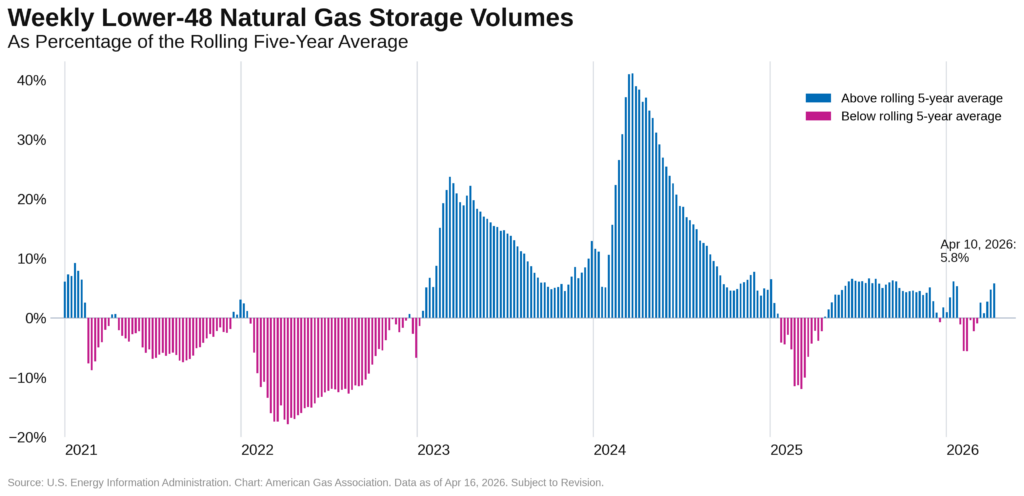
U.S. lower 48 underground storage inventories posted a net injection of 59 Bcf for the week ending April 10, bringing total working gas stocks to 1,970 Bcf, according to the EIA’s latest weekly storage report. Inventories now stand 5.8 percent above the five-year average and 6.8 percent above year-ago levels. Regional injections ranged from 1.0 percent in the Mountain region to a 4.0 percent in the South Central region on a week-over-week basis. Storage levels in the Pacific, Mountain, and South Central regions remain above both their respective five-year averages and year-ago levels. In contrast, inventories in the East and Midwest are 9.3 percent below their five-year averages and 2.7 percent and 0.5 percent below year-ago levels, respectively.
This relatively strong storage position aligns with the EIA’s April STEO, which estimates that underground storage inventories exited the 2025–26 withdrawal season at about 1.9 Tcf, or 3 percent above the five-year average. The STEO projects stronger-than-normal injections to lift storage inventories to roughly 4.0 Tcf by the end of October, about 6 percent above normal, cushioning spot prices into the third quarter of 2026.
Cross-border Pipeline Trade Down Year-Over-Year
Pipeline imports from Canada and exports to Mexico both declined year-over-year for the week ending April 15, falling 25.4 percent and 8.7 percent, respectively, according to preliminary data from Rystad Energy. Trends diverged on a week-over-week basis, with Canadian imports rising 5.2 percent to 3.7 Bcf per day, while exports to Mexico fell 8.7 percent to 5.3 Bcf per day.
Gas Rig Count Declines from Last Week
Baker Hughes reports that the U.S. drilling rig count declined by three for the week ending April 10, bringing the total to 545, driven by a decline in natural gas rigs. The number of oil and miscellaneous rigs remained unchanged for the week. At the state level, Louisiana posted the largest week-over-week percentage increase, rising 7.5 percent, while Utah recorded the steepest decline, falling 7.1 percent. Year-over-year, the natural gas rig count remains 21 percent higher.
What to Watch:
- Production: Despite softer recent output, domestic dry natural gas production is expected to increase in 2026. How might this outlook change if prices remain muted?
- LNG: EU gas storage, currently 12.6 percent below the five-year average, faces mandated refill target deadlines in October. With continued uncertainty around Qatari LNG, how might U.S. LNG demand evolve this summer, and how do existing export capacity constraints shape that outlook?
- Prices: If domestic or global gas markets tighten materially, how might the EIA’s current Henry Hub price outlook shift?
For questions please contact Juan Alvarado | jalvarado@aga.org, Liz Pardue | lpardue@aga.org, or Lauren Scott | lscott@aga.org
To be added to the distribution list for this report, please notify Lucy Castaneda-Land | lcastaneda-land@aga.org
Notice
In issuing and making this publication available, AGA is not undertaking to render professional or other services for or on behalf of any person or entity. Nor is AGA undertaking to perform any duty owed by any person or entity to someone else. Anyone using this document should rely on his or her own independent judgment or, as appropriate, seek the advice of a competent professional in determining the exercise of reasonable care in any given circumstances. The statements in this publication are for general information and represent an unaudited compilation of statistical information that could contain coding or processing errors. AGA makes no warranties, express or implied, nor representations about the accuracy of the information in the publication or its appropriateness for any given purpose or situation. This publication shall not be construed as including advice, guidance, or recommendations to take, or not to take, any actions or decisions regarding any matter, including, without limitation, relating to investments or the purchase or sale of any securities, shares or other assets of any kind. Should you take any such action or decision; you do so at your own risk. Information on the topics covered by this publication may be available from other sources, which the user may wish to consult for additional views or information not covered by this publication.
Copyright © 2025 American Gas Association. All rights reserved.