Natural Gas Market Indicators – May 15, 2026
Natural Gas Market Summary
Mild shoulder season demand and healthy storage injections continue to weigh on domestic natural gas prices as the U.S. approaches summer. Despite lower prices contributing to softer recent output, dry natural gas production has remained resilient year over year, even as drilling activity has moderated. Meanwhile, LNG feedgas demand has declined following scheduled seasonal maintenance at U.S. liquefaction facilities. Looking ahead, the Energy Information Administration (EIA) lowered its Henry Hub spot price forecasts for 2026 and 2027 in the May 2026 Short-Term Energy Outlook (STEO), reducing projected prices by 4.4 percent and 11.5 percent, respectively. At the same time, the EIA revised its natural gas supply and demand outlook upward, reflecting expectations for continued supply growth alongside resilient demand. The updated forecast raises expected 2026 dry production by 0.9 percent and consumption by 0.7 percent.
Globally, geopolitical tensions surrounding the Strait of Hormuz continue to support global natural gas prices and reinforce concerns over global supply security. While Qatar successfully moved limited LNG cargoes through the Strait for the first time since February, broader export flows through the region remain constrained. According to Rystad Energy, prolonged disruptions could tighten the global LNG market by redirecting Atlantic Basin cargoes toward Asia and complicating Europe’s efforts to refill natural gas storage ahead of winter.
EIA Lowers Spot Price Forecasts
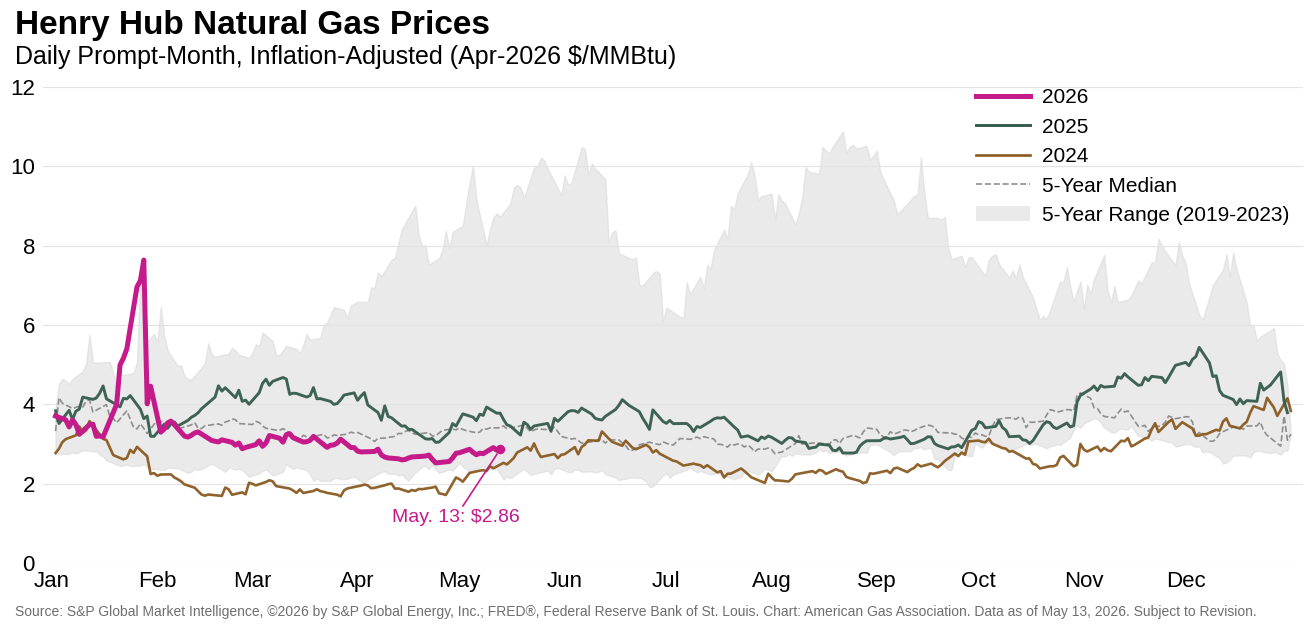
Despite rising 8.2 percent since the rollover to the June 2026 contract on April 29, the Henry Hub prompt month remains under $3 as of May 13 and is nearly 62 percent lower than the near-term high set on January 28. Henry Hub spot prices are similarly muted, remaining generally below $3 since mid-March. In the May 2026 STEO, the EIA lowered its 2026 spot price forecast to $3.50 per MMBtu for the year and cut its 2027 forecast by 11.5 percent.
On an inflation-adjusted basis, prompt-month prices are below both 2025 levels and the five-year median as summer looms. The Henry Hub futures price currently averages $3.26 per MMBtu for contracts through the end of 2026, with the December 2026 contract trading above $4.
Temps Heating Up as Hurricane Season Approaches
Cumulative cooling degree day (CDD) data from April 26 through May 9 indicate notably milder weather conditions, with temperatures running 23.3 percent cooler than last year and 11.5 percent cooler than the 30-year normal. That stretch of relatively mild temperatures, however, may be coming to an end. Through May 24, the National Oceanic and Atmospheric Administration projects moderate to high probabilities for above-normal temperatures across the continental U.S. and Hawaii. The strongest signals for warmer conditions, with probabilities reaching above 70 percent, are concentrated across portions of Georgia, Tennessee, Kentucky, Virginia, and the Carolinas.
Attention is also beginning to shift toward the upcoming Atlantic hurricane season, which officially starts June 1. Colorado State University’s (CSU) initial forecast calls for 13 named storms and six hurricanes for the 2026 season, slightly below the 30-year averages of roughly 14 named storms and seven hurricanes. Of the projected hurricanes, two are expected to reach major hurricane strength.
U.S. Demand Moderates Ahead of Summer Cooling Season
Cooler-than-normal temperatures in early May are weighing on U.S. natural gas demand. Through May 14, total natural gas demand, including exports, is down 4.2 percent compared with the same period in April, according to preliminary data from S&P Global Energy. Domestic consumption is also softer, falling 4 percent month to date, largely driven by an 18.5 percent decline in residential and commercial sector demand. Despite the recent slowdown, demand remains stronger than year-ago levels, with total demand and domestic consumption up 6.5 percent and 5.2 percent, respectively, for the month so far. Year to date, total natural gas demand is running 1.7 percent above 2025 levels.
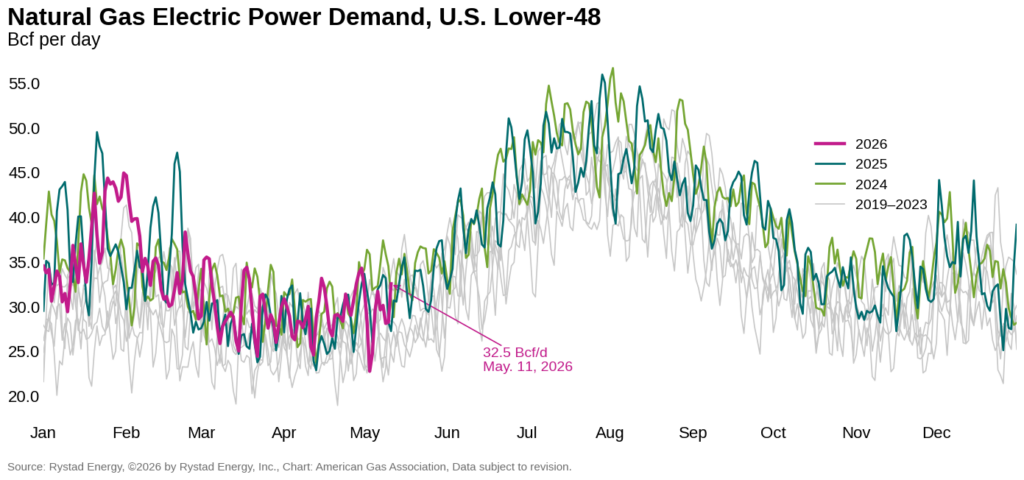
Natural gas demand from the electric sector has also moderated alongside milder temperatures, but that trend may be changing. Through May 11, month-to-date power sector demand was 2.1 percent higher than the same period in April but nearly 6 percent below year-ago levels, according to preliminary data from Rystad Energy. Year-to-date demand in the sector is 0.7 percent higher than the same period in 2025. As summer approaches, weather-driven cooling demand and natural gas prices will play an important role in shaping power sector consumption trends.
Production Edges Lower as Spring Shoulder Season Continues
U.S. natural gas production has remained somewhat softer through the spring shoulder season, though overall output continues to run well above year-ago levels. Month-to-date through May 14, dry gas production is down a modest 0.2 percent from April but 3.3 percent higher than the same period last year, according to preliminary data from S&P Global Energy. Despite the recent slowdown, the EIA raised its 2026 dry natural gas production estimate by 1 Bcf per day—nearly 1 percent—in its May 2026 STEO. The 2027 projection also increased by 2.1 percent
Recent upstream transactions in the Anadarko Basin point to continued investor confidence in long-lived U.S. natural gas assets, particularly those supported by established infrastructure and stable production profiles. In separate transactions announced in May, Jonah Energy acquired Scout Energy’s Western Anadarko Basin assets for more than $1 billion, while Diversified Energy and Carlyle agreed to acquire Camino Natural Resources’ Anadarko Basin package for approximately $1.2 billion. Rystad Energy reports that the recent transactions include hundreds of MMcf equivalent per day of natural gas production and large acreage positions across Oklahoma, Kansas, and the Texas Panhandle, underscoring ongoing interest in mature, gas-weighted assets despite softer near-term natural gas prices.
LNG Feedgas Down on Scheduled Maintenance
U.S. LNG feedgas demand is easing in May as routine spring maintenance at liquefaction facilities and a compressor issue at Freeport LNG temporarily curb natural gas intake. Through May 10, feedgas deliveries are 10 percent lower than the same period in April. Yet, despite the seasonal slowdown, demand remains well above year-ago levels, up nearly 13 percent month-to-date and 19 percent year-to-date. Through the rest of 2026, Trains 6 and 7 at Corpus Christi Stage 3 LNG and Train 2 at Golden Pass LNG are expected to begin operations.
Global LNG markets remain constrained as disruptions tied to the Strait of Hormuz continue to limit exports from the region. Rystad Energy reports that Qatar recently completed its first successful LNG transit through the Strait since tensions escalated earlier this year, but the shipment appears tied to a limited bilateral arrangement with Pakistan rather than a broader reopening of regional LNG trade. While a small number of cargoes from Qatar, Abu Dhabi National Oil Company (ADNOC), and Oman LNG have resumed movement, flows remain well below normal and have done little to ease global supply concerns. Rystad Energy notes that financial markets have, so far, remained relatively calm despite ongoing shipping disruptions and growing concerns about tighter global ener
Above-Average Storage Injections Expected Through October
The EIA reports a net injection of 85 Bcf into underground natural gas storage for the week ending May 8, lifting total inventories to nearly 2.3 Tcf. Storage builds for the week are concentrated in the East and South Central regions, which each posted net injections of 27 Bcf, and the Midwest, which added 24 Bcf to its inventories.
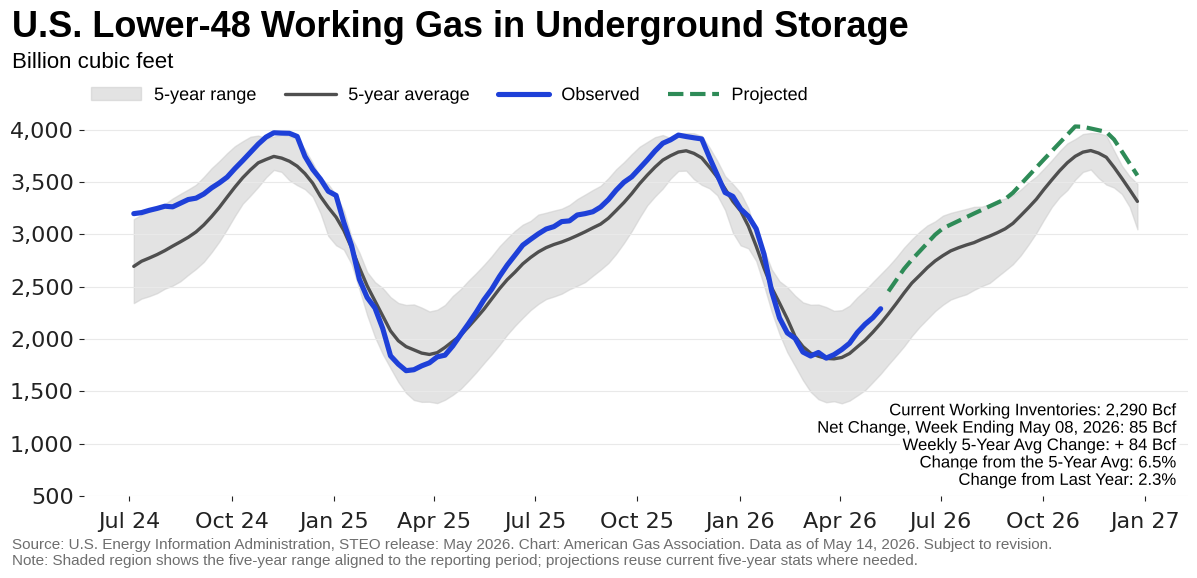
Following the latest report, lower 48 inventories stand 6.5 percent above the five-year average and 2.3 percent above year-ago levels, underscoring the market’s relatively well-supplied state heading into summer. Regional inventories remain above their respective five-year averages across most of the country, except in the Midwest, where storage is 0.8 percent below its five-year average.
In its May 2026 STEO, the EIA reported that underground storage drawdowns exceeded 2 Tcf this past winter, leaving inventories 4 percent higher than the five-year average at the end of March. This end-of-winter surplus contributed to softer April spot prices. Through October, the EIA anticipates injections into underground storage will be above average, contributing to an estimated surplus of 7 percent to the five-year average by the start of winter.
Cross-Border Pipeline Flows Mixed
May cross-border pipeline flows are generally down on mild temperatures. Natural gas imports from Canada are down 6.1 percent for the month to date through May 12 compared to the same period in April, and 15.5 percent lower than the same period last year, according to preliminary data from Rystad Energy. By comparison, pipeline exports to Mexico are up 0.8 percent month-over-month, but lag the same period last year by 2.3 percent. For the year to date, imports from Canada are down 11.6 percent, while exports to Mexico are nearly 2 percent higher.
Gas Drilling Activity Softens Week-over-Week
The U.S. drilling rig count increased by one to 548 for the week ending May 8, according to Baker Hughes, as a modest increase in oil-directed drilling offset a one-rig decline in natural gas activity. Since the end of December, the total natural gas rig count has increased by 15 to 128, while oil-directed rigs have declined by 32. Appreciating crude oil prices have supported a more stable near-term outlook for drilling activity, while lower natural gas prices continue to weigh on gas-directed rigs.
What to Watch:
- Power demand: How might higher natural gas prices this summer affect natural gas’s share of the thermal generation stack?
- Storage: Will expectations for above-average injections this refill season keep natural gas prices below $3 through summer?
- LNG: With continued global market tightness and new liquefaction trains commissioning in the second half of 2026, will LNG feedgas demand set a new record this year?
For questions please contact Juan Alvarado | jalvarado@aga.org, Liz Pardue | lpardue@aga.org, or Lauren Scott | lscott@aga.org
To be added to the distribution list for this report, please notify Lucy Castaneda-Land | lcastaneda-land@aga.org
Notice
In issuing and making this publication available, AGA is not undertaking to render professional or other services for or on behalf of any person or entity. Nor is AGA undertaking to perform any duty owed by any person or entity to someone else. Anyone using this document should rely on his or her own independent judgment or, as appropriate, seek the advice of a competent professional in determining the exercise of reasonable care in any given circumstances. The statements in this publication are for general information and represent an unaudited compilation of statistical information that could contain coding or processing errors. AGA makes no warranties, express or implied, nor representations about the accuracy of the information in the publication or its appropriateness for any given purpose or situation. This publication shall not be construed as including advice, guidance, or recommendations to take, or not to take, any actions or decisions regarding any matter, including, without limitation, relating to investments or the purchase or sale of any securities, shares or other assets of any kind. Should you take any such action or decision; you do so at your own risk. Information on the topics covered by this publication may be available from other sources, which the user may wish to consult for additional views or information not covered by this publication.
Copyright © 2025 American Gas Association. All rights reserved.