Natural Gas Market Indicators – April 18, 2024
Natural Gas Market Summary
In the latest market developments as of mid-April, Henry Hub May futures are trading below $2.00 per MMBtu, based on data from CME, futures are expected to escalate starting in July, peaking at $3.72 in January 2025. Recent severe weather is giving way to warmer temperatures; however, a cold front is forecasted to impact the Central and Eastern U.S. within the next week. Natural gas demand saw a notable uptick during a recent solar eclipse on April 8, with natural gas stepping in to compensate for the temporary loss of solar capacity. Overall, demand for natural gas in early April slightly exceeded that of the previous year. On the production front, a decline is anticipated across most U.S. regions, with total production slightly decreasing week-over-week. In the LNG sector, the U.S. reported a 10 percent increase in natural gas exports in 2023 over the previous year, with significant year-over-year growth in pipeline exports to Canada and Mexico. The injection season for natural gas storage began robustly, with storage levels substantially higher than last year and the five-year average. Amidst these dynamics, rig counts have slightly decreased, reflecting broader trends and responses to ongoing price pressures in the natural gas market.
Reported Prices
As April is well underway, May futures at Henry Hub are trading at $1.75 per MMBtu as of April 18. While futures for both May and June remain below $2.00 per MMBtu, contract prices begin to rise in July and continue to reach as high as $3.76 in January of 2025. A recent article published in RBN Energy reports negative natural gas spot prices out of Waha Hub in the Permian Basin. Based on preliminary data from Natural Gas Intelligence, Waha spot prices averaged negative $2.23 per MMBtu for the week ending April 12, roughly $4.00 per MMBtu below spot prices seen out of Henry Hub. According to the article, spot prices have become increasingly negative since maintenance began on the Coast Express on April 9 and will not conclude until May 2. The Coast Express carries natural gas East near Corpus Christi, while the maintenance on the Westbound El Paso pipeline continues to cause disruptions. As maintenance on both the Eastbound and Westbound capacity is constrained, the price to move uncontracted natural gas out of the Permian Basin continues to rise.
Weather
Following a stretch of severe weather across much of the central U.S., and a snow storm in the North East, temperatures have abated in favor of warmer weather. NOAA’s 16 day forecast beginning Wednesday of this week predicts warmer temperatures across the central and Eastern U.S. through the end of the week before a cold front descends from the North into the Central states over the weekend, pushing East into next week. Looking to the week prior, the weather in the U.S. was roughly nine percent colder than last year and three percent colder than normal as measured by heating degree days (HDDs) for the week ending April 6. For March, the weather in the U.S. was 16 percent warmer than last year and 11 percent warmer than normal as measured by HDDs.
Taking a retrospectice look, the end of March brings the conclusion of the 2023 – 2024 winter heating season, and this season proved to be warmer than normal as measured by heating degree days. Excluding January, every month from October 2023 – March 2024 was warmer than the same month the previous year. Every single month was warmer than normal, averaging roughly 15 percent warmer than normal.
Demand
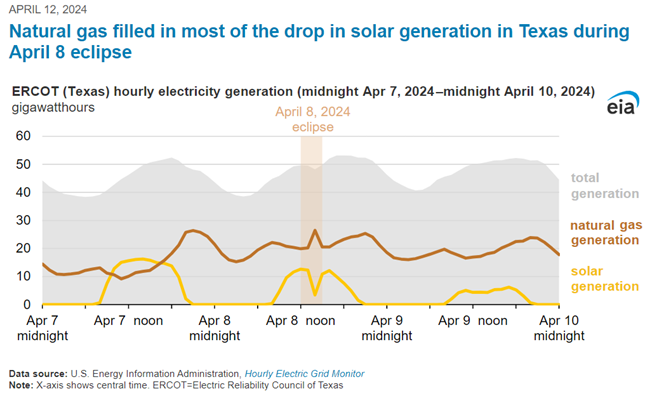
On April 8, the U.S. experienced a total solar eclipse on a path that spanned from Texas to Maine, and the flexibility of natural gas generation was similarly on display. Along this path of totality, solar generation temporarily declined, resulting in a commensurate rise in natural gas power generation to fill the gap. As reported by the April 12 edition of the EIA’s Today in Energy, the Electric Reliability Council of Texas (ERCOT) lost approximately 8.9 gigawatts of solar capacity for the duration of the eclipse. While solar capacity was offline, natural gas proved to be an accessible resource and accounted for roughly 80% of replacement capacity. The 80% equates to approximately 6.2 gigawatts of power between one and two PM Central Time, the hour in which the totality took place.
Demand for natural gas averaged 93.63 Bcf per day for the first 15 days of April, roughly 0.29 Bcf per day more than the same time last year, according to preliminary data from S&P Global Commodity Insights. A closer look at the report for the week ending April 10 shows that the EIA reported a 1.9 Bcf per day decline in consumption from the week prior. The drop in demand was primarily the result of the 1.5 Bcf per day decrease in consumption from the residential and commercial sectors as reported by the EIA Natural Gas Weekly Update.
Production
The EIA Drilling Productivity Report forecasts a decline in natural gas production across six of the seven reported production regions. The anticipated decline from April to May represents a 0.26 Bcf change from roughly 100 Bcf per day in production to roughly 99.74 Bcf per day. This anticipated decline could be the reaction to the production adjustments announced by CNX resources as they delay rig completion. Looking at production on a closer timescale, week-over-week production declined 0.06 Bcf per day from 100.9 to 100.3 Bcf per day for the week ending April 10.
LNG Markets
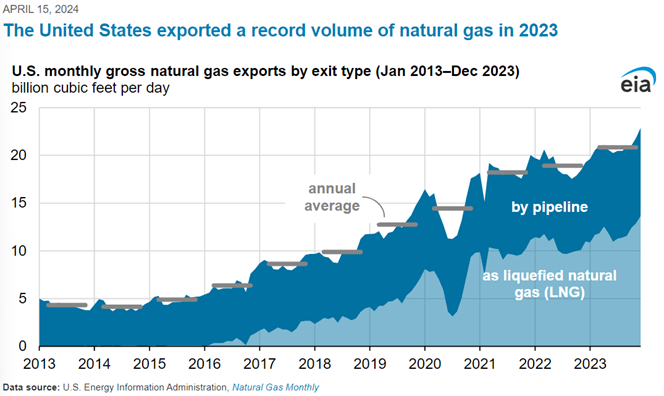
The U.S. exported ten percent more natural gas in 2023 than in 2022, as reported by the April 15 release of the EIA’s Today in Energy. According to EIA analysis, LNG exports increased 1.3 Bcf per day (22 percent) from 2022 to 2023, with a record 13.6 Bcf per day in LNG exports in December of 2023. Exports by pipeline to both Canada and Mexico increased year-over-year. Exports to Canada averaged 2.8 Bf per day, a seven percent increase from 2023, while exports to Mexico averaged 6.1 Bcf per day, reflecting an eight percent increase. The U.S. has exported more natural gas than it has imported since 2017. The last time natural gas exports exceeded imports was in 1956.
In more recent news, the EIA reports that average natural gas deliveries to U.S. LNG export terminals rose 0.1 Bcf per day week-over-week to an average of 12.6 Bcf per day for the week ending April 10. While deliveries to export terminals increased, 22 LNG vessels with a combined carrying capacity of 75 Bcf departed the U.S. between April 4 and 10. International prices saw a sharp increase starting April 15, influenced in part by geopolitical events in the Middle East. Prompt-month futures prices at both JKM climbed to $11.26 per MMBtu. Similarly, Dutch TTF prices jumped sharply on April 16 and are currently at $10.50 per MMBtu, reversing all the price declines at that hub since the beginning of the year.
Working Gas in Underground Storage
The first injections into storage this refill season are reported by the Energy Information Administration Natural Gas Storage Dashboard as 24 Bcf are pumped into storage for the week ending April 5, beginning refill season with storage levels reporting roughly 2,283 Bcf. Working gas in underground storage is beginning the refill season 435 Bcf, or 25 percent, higher than last year. Current levels are also 38 percent higher than the five-year average of 1,650 Bcf, and well above those storage levels seen at the beginning of the 2023 season, as underground storage levels across the country are already roughly 56 percent full.
Pipeline Imports and Exports
Imports from Canada have increased 0.5 Bcf per day from 4.8 to 5.3 Bcf per day week-over-week for the week ending April 10. Exports to Mexico have also increased week-over-week from 5.9 to 6.0 Bcf per day, as reported by the EIA.
Rig Count
Baker Hughes reports a total of 617 rigs for the week ending April 12, a week-over-week decline of two oil-directed rigs and one gas-directed rig. One year ago, there were 588 oil-directed rigs and 157 gas-directed rigs. Notably, the number of gas rigs has fallen 31 since last year, while oil has only dropped 14 percent, reflecting the sharp decline in natural gas commodity prices but the relatively modest decline in oil prices. Further pressure on gas rigs reflects various announcements from producers such as EQT planning a one BCF per day decline in production as well as CNX Resources delaying rig completion.
For questions please contact Juan Alvarado | jalvarado@aga.org or Morgan Hoy | mhoy@aga.org
To be added to the distribution list for this report, please notify Lucy Castaneda-Land | lcastaneda-land@aga.org
NOTICE
In issuing and making this publication available, AGA is not undertaking to render professional or other services for or on behalf of any person or entity. Nor is AGA undertaking to perform any duty owed by any person or entity to someone else. Anyone using this document should rely on his or her own independent judgment or, as appropriate, seek the advice of a competent professional in determining the exercise of reasonable care in any given circumstances. The statements in this publication are for general information and represent an unaudited compilation of statistical information that could contain coding or processing errors. AGA makes no warranties, express or implied, nor representations about the accuracy of the information in the publication or its appropriateness for any given purpose or situation. This publication shall not be construed as including, advice, guidance, or recommendations to take, or not to take, any actions or decisions regarding any matter, including without limitation relating to investments or the purchase or sale of any securities, shares or other assets of any kind. Should you take any such action or decision; you do so at your own risk. Information on the topics covered by this publication may be available from other sources, which the user may wish to consult for additional views or information not covered by this publication.
Copyright © 2024 American Gas Association. All rights reserved.