Natural Gas Market Indicators – July 17, 2025
Natural Gas Market Summary
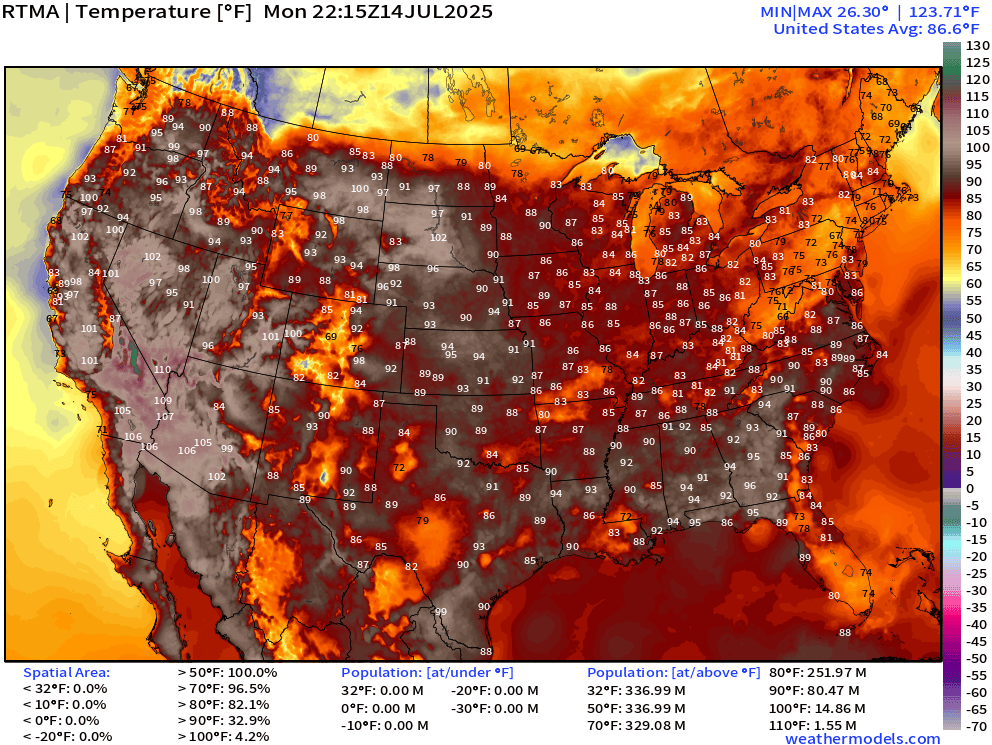
Hot temperatures are expected to continue across the contiguous U.S. in July, bringing the potential for rising natural gas demand, particularly in the electric power sector. Last week, Phoenix reached its hottest temperature for the year to date of 118°F, only four degrees cooler than the city’s all-time high set in June of 1990. As of July 14, the average temperature in the U.S. was more than 86°F with maximum temperatures nearing 124 degrees, according to Dr. Ryan Maue at Weather Trader.
The summer heat is helping to sustain strong production and consumption trends in 2025, following record daily demand this winter. For the year to date through June, Rystad Energy reports that natural gas production levels are averaging 3.5 Bcf per day, or 3.4 percent higher than the same period in 2024. Domestic consumption is also higher year-over-year, exceeding 2024 levels by 1.2 Bcf per day or 1.4 percent for the year to date. Despite rising summer consumption, net storage injections for the refill season to date remain at the highest level since 2019.
Henry Hub Futures Up Slightly on Hot Forecast
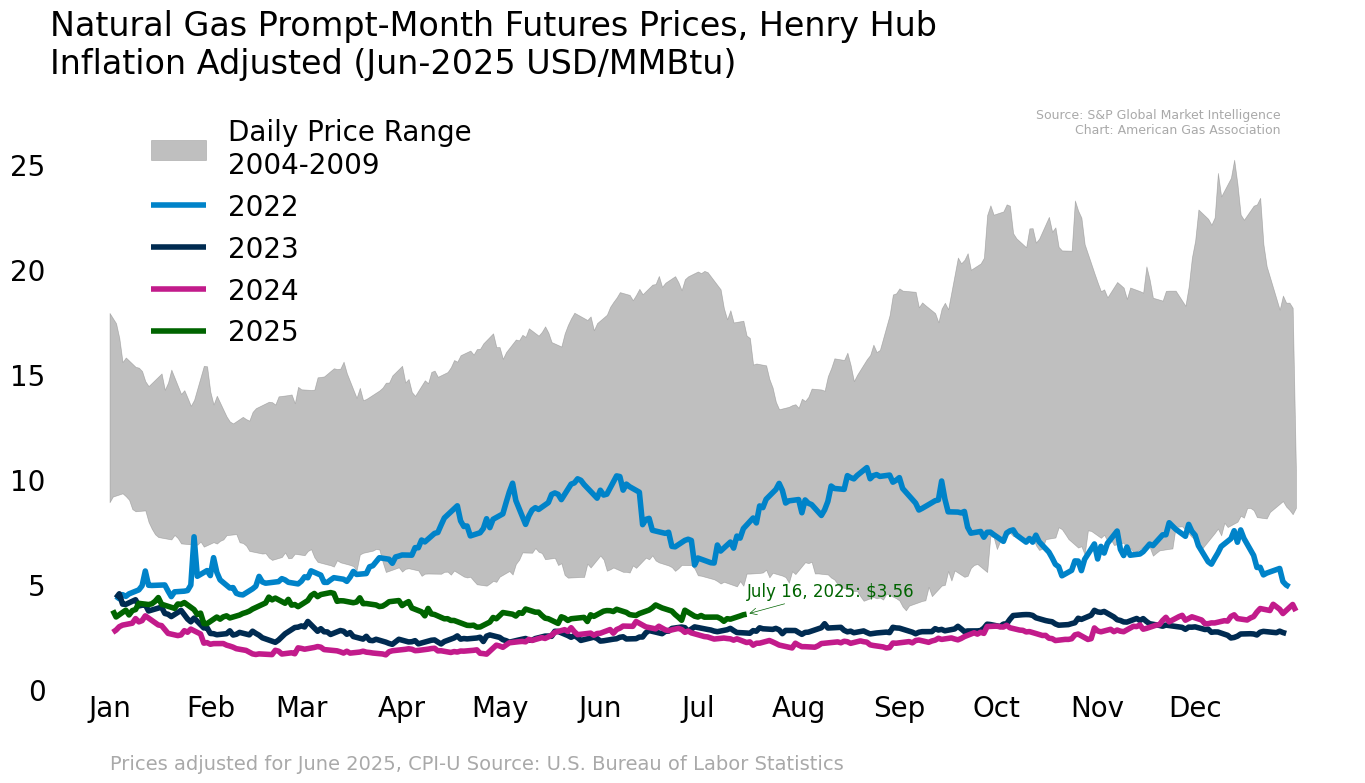
Henry Hub futures settled at $3.55 per MMBtu on July 16, 10.5 percent higher week-over-week and 4 percent higher than the first trading day of July, according to CME. Despite the short-term increase, August prompt-month contracts remain 5 percent lower than the rollover from the July contract on June 27. The 12-month strip settled at $4.13 per MMBtu on July 16, down nearly 3 percent since June 27 but 6.5 percent higher week-over-week. Intraday on July 17, Henry Hub prompt-month prices approached $3.63 per MMBtu.
Argus reports the following regional natural gas spot prices as of July 16:
- The highest regional price of $5.71 per MMBtu occurred in the Northeast, up nearly 93 percent week-over-week due to rising cooling demand, including a five cooling degree day (CDD) increase from July 14 to 15, according to the National Oceanic and Atmospheric Administration (NOAA).
- The Rockies and Northwest had the lowest regional price at $2.71 per MMBtu.
- Regional prices in other areas ranged from $2.72 per MMBtu in the Southwest to $3.61 per MMBtu in Louisiana and the Southeast.
Above-Normal Temperatures on the Horizon
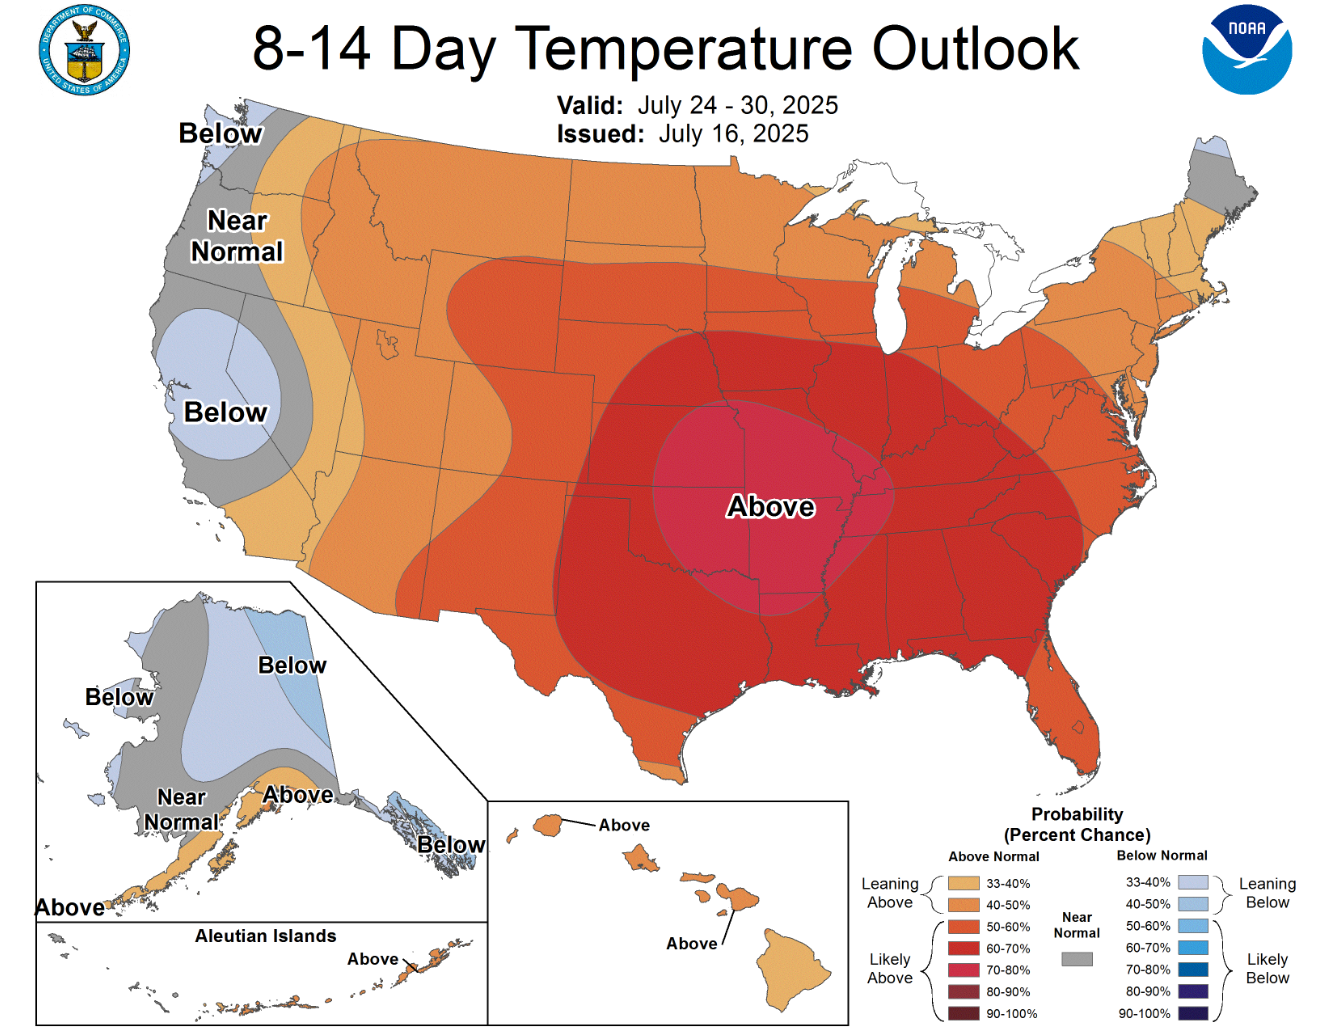
According to NOAA, much of the U.S. is expected to see above-normal temperatures into late July, with the highest probabilities from the Midwest through the South and Mid-Atlantic. The Pacific states and western Nevada buck the trend with below- or near-normal probabilities. Looking at the stats on the books for the week ending July 12, temperatures in the U.S. were 6.6 percent cooler than last year and 19.7 percent warmer than the 30-year normal based on population-weighted CDDs. All regions were colder than last year except for East North Central, West North Central, East South Central, and West South Central. In addition, all regions were warmer than normal except the West South Central.
As of July 15, NOAA’s National Hurricane Center is monitoring one disturbance in the Gulf, with a less than 40 percent chance of cyclone formation over the next week. No disturbances are reported in the Eastern or Central Pacific.
Domestic Demand Remains in Record Territory Year to Date
Domestic natural gas consumption for the week ending July 17 increased 2.5 percent week-over-week, according to preliminary data from S&P Global. Compared to the same week last year, domestic consumption is down 6.4 percent. Natural gas demand is being primarily driven by a 3.8 percent week-over-week increase in the electric power sector and a 2.8 percent week-over-week increase in residential and commercial sector consumption. Industrial demand for natural gas is down 0.2 percent for the week.
Dry Gas Production Remains Elevated Off the Recent Daily Record
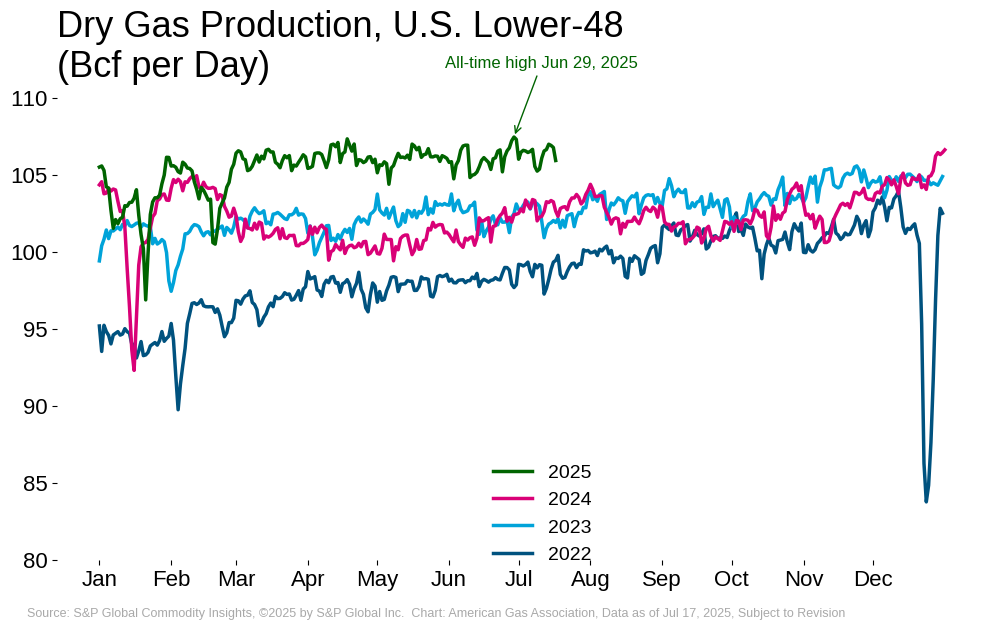
U.S. natural gas supplies have been bolstered by strong flowing dry gas production, driven by production increases in the Northeast, Southeast, and Texas. Dry gas production hit a daily record on June 29 based on S&P Global daily data and is currently averaging 106.2 Bcf per day for the week ending July 9, according to data from the Energy Information Administration. Preliminary data from S&P Global suggests a 0.5 percent production increase for the week ending July 17, and a 3.5 percent increase compared to the same period last year.
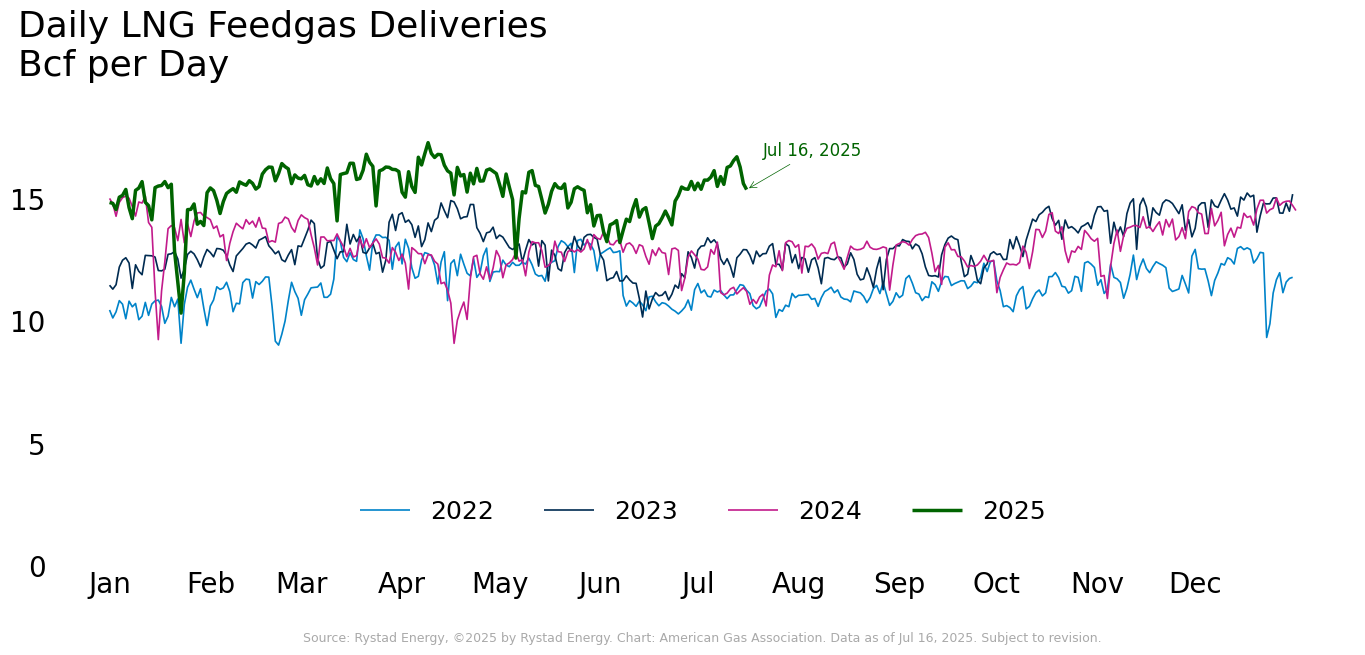
LNG Feedgas Deliveries at Record Levels Year to Date
Feedgas demand remains strong year-over-year due to new liquefaction nameplate capacity and strong utilization. Venture Global announced an amendment to its Sales and Purchase Agreement with SEFE, Germany’s state-owned energy company, adding 0.75 million tons per annum (MTPA) to a combined total of 3.0 MTPA as part of a 20-year offtake agreement from Calcasieu Pass. The deal signals another long-term European agreement for U.S. LNG as the continent addresses long-term supply needs.
According to Rystad Energy, LNG feedgas deliveries increased 2.4 percent week-over-week to 15.4 Bcf per day for the week ending July 16. Compared to the same period last year, feedgas deliveries are up 44.5 percent, primarily due to reduced feedgas flows to Freeport LNG as a result of Hurricane Beryl and routine maintenance at other LNG facilities in July 2024. For the week ending July 9, 27 vessels with a combined carrying capacity of 104 Bcf departed the U.S., according to Bloomberg Finance L.P. data cited by the EIA. The number of vessels declined by three compared to the week prior, and the total carrying capacity is down 9 Bcf.
Several proposed and operational LNG export facilities along Louisiana’s Calcasieu Ship Channel have raised concerns about potential congestion in Gulf shipping lanes, according to Yahoo! Finance. Venture Global has formally requested that the Federal Energy Regulatory Commission review how future projects might impact existing export operations. Six total projects, including Commonwealth LNG, Cameron LNG, and others, are clustered along or near the channel. Industry stakeholders have cited vessel traffic and shared waterway access as areas to monitor as U.S. LNG export capacity continues to grow.
Globally, higher-than-average summer temperatures in Asia, especially in Japan and South Korea, are driving spot LNG demand and supporting Asia-Pacific price premiums, according to Rystad Energy. South Korean demand is tempered by maintenance at gas-fired plants, but heat-driven power needs persist. While U.S.-origin LNG cargoes typically launch into the Atlantic and require longer transit times to reach Asia, LNG Canada offers a faster alternative that could help ease supply pressures in the region.
Underground Storage Gains 46 Bcf in Most Recent Report
Net injections into underground storage of 46 Bcf for the week ending July 11 brought total underground storage inventories to 3,052 Bcf, according to the EIA. Storage levels for the week are 6.2 percent higher than the five-year average but 4.9 percent below year-ago levels. The Mountain region has the largest surplus over the five-year average of 25 percent, while the Midwest has the smallest surplus of 1.7 percent. Compared to last year, the Pacific is the only region with inventories above year-ago levels.
Imports from Canada Climb Week-over-Week
For the week ending July 17, natural gas imports from Canada increased 4 percent week-over-week and 0.8 percent year-over-year, according to preliminary data from S&P Global. By comparison, exports to Mexico are down 2.2 percent week-over-week and 6.4 percent year-over-year.
Weekly Gas Rig Counts Stable for First Time in Ten Weeks
According to Baker Hughes, the total U.S. rig count declined by two rigs week-over-week, landing at 537 rigs as of July 11. The U.S. gas rig count of 108 had no change week-over-week. Reuters highlights this week as the first time in ten weeks that gas rig counts have not declined. Compared to year-ago levels, the total count for the week is up by eight gas rigs. The week ending July 11 also marks the lowest gas rig count in Texas since November 2021, decreasing to 255, according to Reuters. While gas rig counts decreased in Texas, rigs in the Haynesville Basin increased by one rig to 38, the highest since March 2024.
What to Watch:
- Prices: With hotter temperatures forecasted through July, will electric power demand cause futures prices to rise?
- Rig Count: Will the recent stability of gas rig counts continue in the near term?
- Supply: With higher temperatures likely to increase demand in the near term, will production levels be sufficient to meet consumption needs while refilling underground storage?
For questions please contact Juan Alvarado | jalvarado@aga.org, Liz Pardue | lpardue@aga.org, or
Lauren Scott | lscott@aga.org
To be added to the distribution list for this report, please notify Lucy Castaneda-Land | lcastaneda-land@aga.org
NOTICE
In issuing and making this publication available, AGA is not undertaking to render professional or other services for or on behalf of any person or entity. Nor is AGA undertaking to perform any duty owed by any person or entity to someone else. Anyone using this document should rely on his or her own independent judgment or, as appropriate, seek the advice of a competent professional in determining the exercise of reasonable care in any given circumstances. The statements in this publication are for general information and represent an unaudited compilation of statistical information that could contain coding or processing errors. AGA makes no warranties, express or implied, nor representations about the accuracy of the information in the publication or its appropriateness for any given purpose or situation. This publication shall not be construed as including advice, guidance, or recommendations to take, or not to take, any actions or decisions regarding any matter, including, without limitation, relating to investments or the purchase or sale of any securities, shares or other assets of any kind. Should you take any such action or decision; you do so at your own risk. Information on the topics covered by this publication may be available from other sources, which the user may wish to consult for additional views or information not covered by this publication.
Copyright © 2025 American Gas Association. All rights reserved.Natural Gas Market Indicators – June 6, 2025