Natural Gas Market Indicators – March 7, 2024
Natural Gas Market Summary
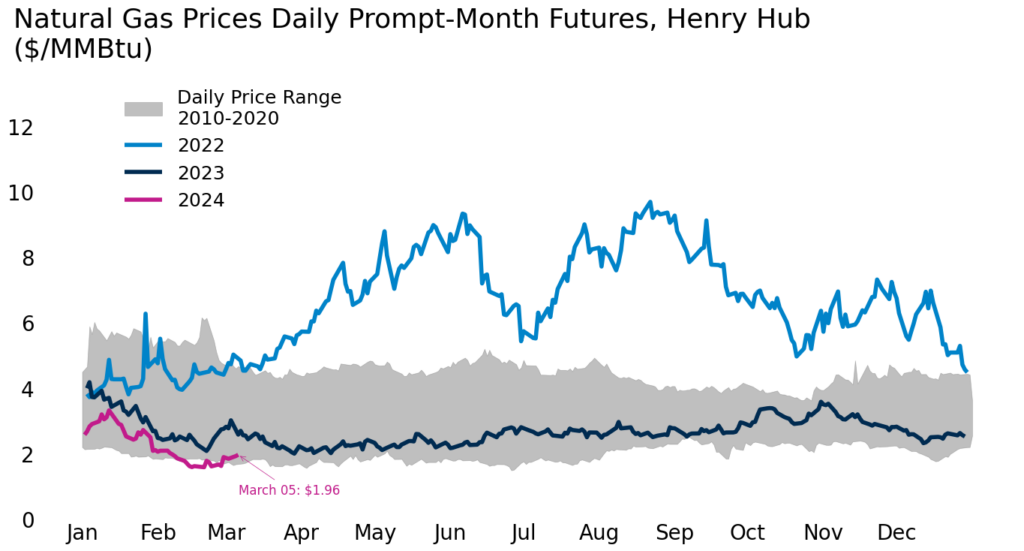
This winter has seen strong natural gas demand and even stronger production which contributed to record-low prices in February. Some signals in the market point to a rebalancing of supply and demand as we approach the shoulder season with higher-than-average storage numbers and producers signaling limited production curtailments. However, as of March 7, the Henry Hub future prices remain below 3 dollars through October.
Reported Prices
Henry Hub spot prices fell to a record low in February, averaging $1.50 per MMbtu on February 20, the lowest inflation-adjusted price since at least 1997, according to the U.S. Energy Information Administration. However, a March rally brought prices back above $1.95 per MMBtu. Looking at cash prices, the day-ahead index for March 5, 2024 shows natural gas prices trading below $2 per MMBtu nearly everywhere in the country, with some hubs now below $1. Meanwhile, future prices at the Henry Hub remain below 3 dollars through October.
Weather
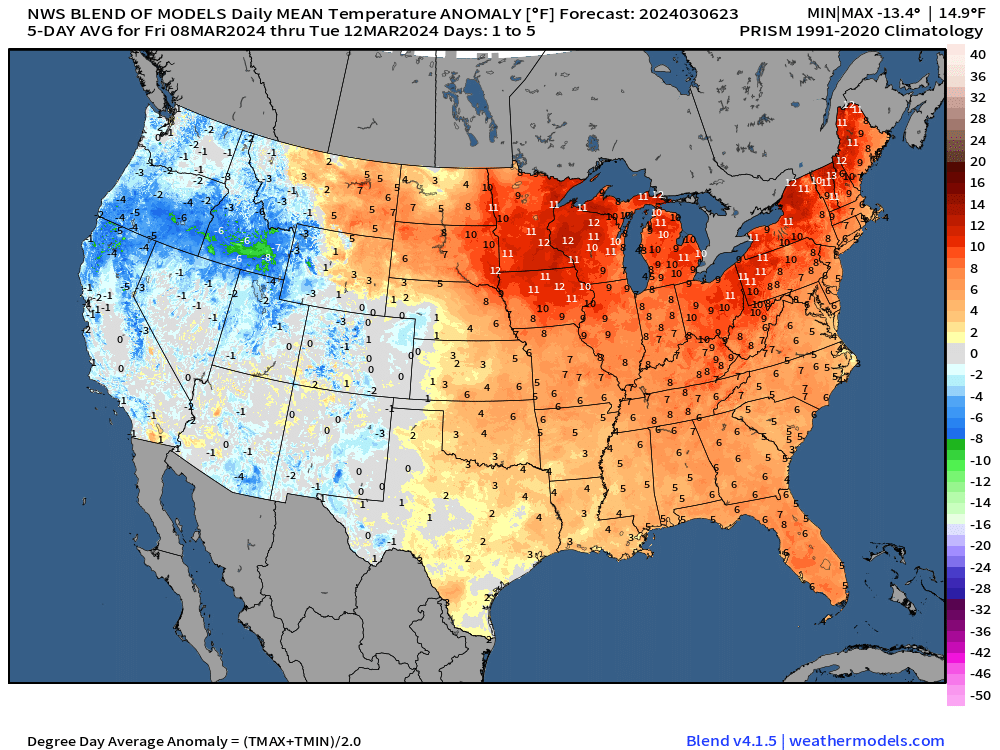
It’s been a warm winter so far despite the brutal January cold. For winter 2023-2024, October through February, cumulative heating degree days have been 11.9 percent below (warmer) the 30-year normal and 5.0 percent warmer than the prior winter. Every region has been warmer than normal. Looking ahead, March 4 – March 10, 2024 look to be colder than normal in the western U.S., with widespread warmth in the Eastern half, particularly the midwest up through New England, according to the European Centre for Medium-Range Weather Forecasts.
Demand
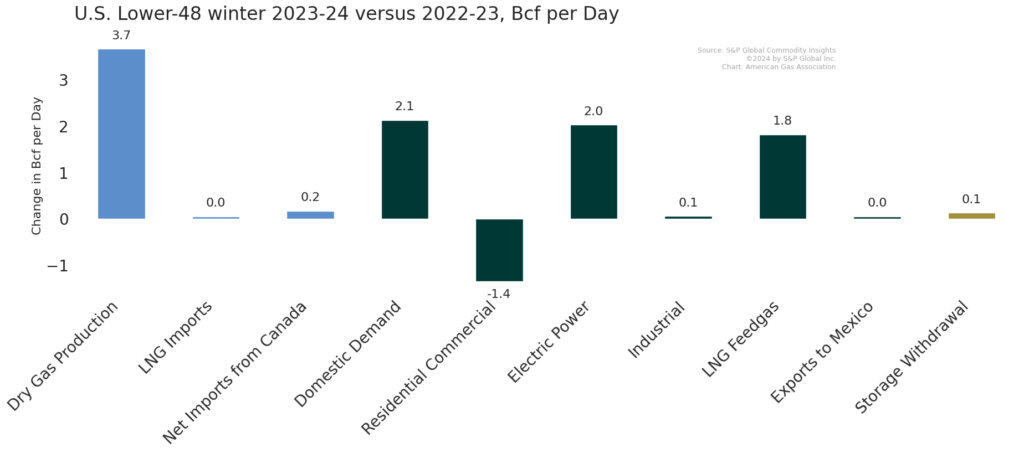
Demand has been sluggish over the first week of March. Month-to-date demand is 8.5 Bcf per day below March 2023, with declines in demand for power burn, industrial, and residential and commercial use. However, the short-term demand drop is not indicative of the entire winter. Winter 2023-24 demand since November is up 2.1 Bcf per day compared with last winter, driven by increased use in the power sector. Boosting overall demand further is LNG feedgas flows, which are up 1.8 Bcf per day this winter relative to last.
Production
While demand is up, production is up even more. Winter dry gas production since November is up 3.7 Bcf per day from 2022-2023. However, some players in the market are indicating production cuts are in the forecast. Multiple producers have announced guidance indicating lower production flows in 2024. For example, EQT announced on March 4 that it would curtail approximately 1 Bcf per day of production beginning in late February. Dry gas production stands at 103 Bcf per day, according to S&P Global Commodity Insights.
Pipeline Imports and Exports
The EIA reported a sharp decline in pipeline imports from Canada of about 0.9 Bcf per day. The new average represents an 18 percent month-over-month decline and a 13 percent decline year over year. For the week ending February 28 average daily pipeline exports to Mexico dropped by 0.1 Bcf from 5.9 Bcf to 5.8 Bcf.
LNG Markets
The LNG permitting pause announced by the Biden Administration in late January has not slowed down LNG demand thus far. This winter, natural gas deliveries to LNG facilities are up 1.8 Bcf per day. Additionally, on March 6 Reuters reported that Aramco, the Saudi-owned petroleum and natural gas company, and ADNOC, the state-owned petroleum and natural gas company of the United Arab Emirates are in talks to invest in US LNG projects. The interest in US LNG follows a big LNG expansion push by Qatar, which aims to “control nearly 25% share of the global market by 2030”. Meanwhile, Tellurian announced a change in leadership. According to Natural Gas Intelligencer, the move was made as Tellurian aims to fast-track the completion of its LNG facility in Driftwood, LA.
Working Gas in Underground Storage
The EIA reports a net decrease in storage stocks of 40 Bcf. With the shoulder seasons rapidly approaching, storage inventories remain 13.6 percent above year-ago levels and 30.9 percent above the 5-year average, placing current stocks above the historical five-year range. The EIA also reports that the rate of withdrawal this weekend is not 18 percent below the five-year average. Should withdrawals through the end of the withdrawal season match the five-year average, the EIA expects the inventory at the end of the withdrawal season to be 30 percent above the five-year average.
Rig Count
Baker Hughes reports a total of 625 rigs for the week ending March 1, a 17 percent decline from year-ago levels. As of March 1, 119 rigs were gas-directed and 506 rigs were oil-directed.
For questions please contact Juan Alvarado | jalvarado@aga.org or Morgan Hoy | mhoy@aga.org
To be added to the distribution list for this report, please notify Lucy Castaneda-Land | lcastaneda-land@aga.org
NOTICE
In issuing and making this publication available, AGA is not undertaking to render professional or other services for or on behalf of any person or entity. Nor is AGA undertaking to perform any duty owed by any person or entity to someone else. Anyone using this document should rely on his or her own independent judgment or, as appropriate, seek the advice of a competent professional in determining the exercise of reasonable care in any given circumstances. The statements in this publication are for general information and represent an unaudited compilation of statistical information that could contain coding or processing errors. AGA makes no warranties, express or implied, nor representations about the accuracy of the information in the publication or its appropriateness for any given purpose or situation. This publication shall not be construed as including, advice, guidance, or recommendations to take, or not to take, any actions or decisions regarding any matter, including without limitation relating to investments or the purchase or sale of any securities, shares or other assets of any kind. Should you take any such action or decision; you do so at your own risk. Information on the topics covered by this publication may be available from other sources, which the user may wish to consult for additional views or information not covered by this publication.
Copyright © 2024 American Gas Association. All rights reserved.