Natural Gas Market Indicators – May 8, 2025
Natural Gas Market Summary
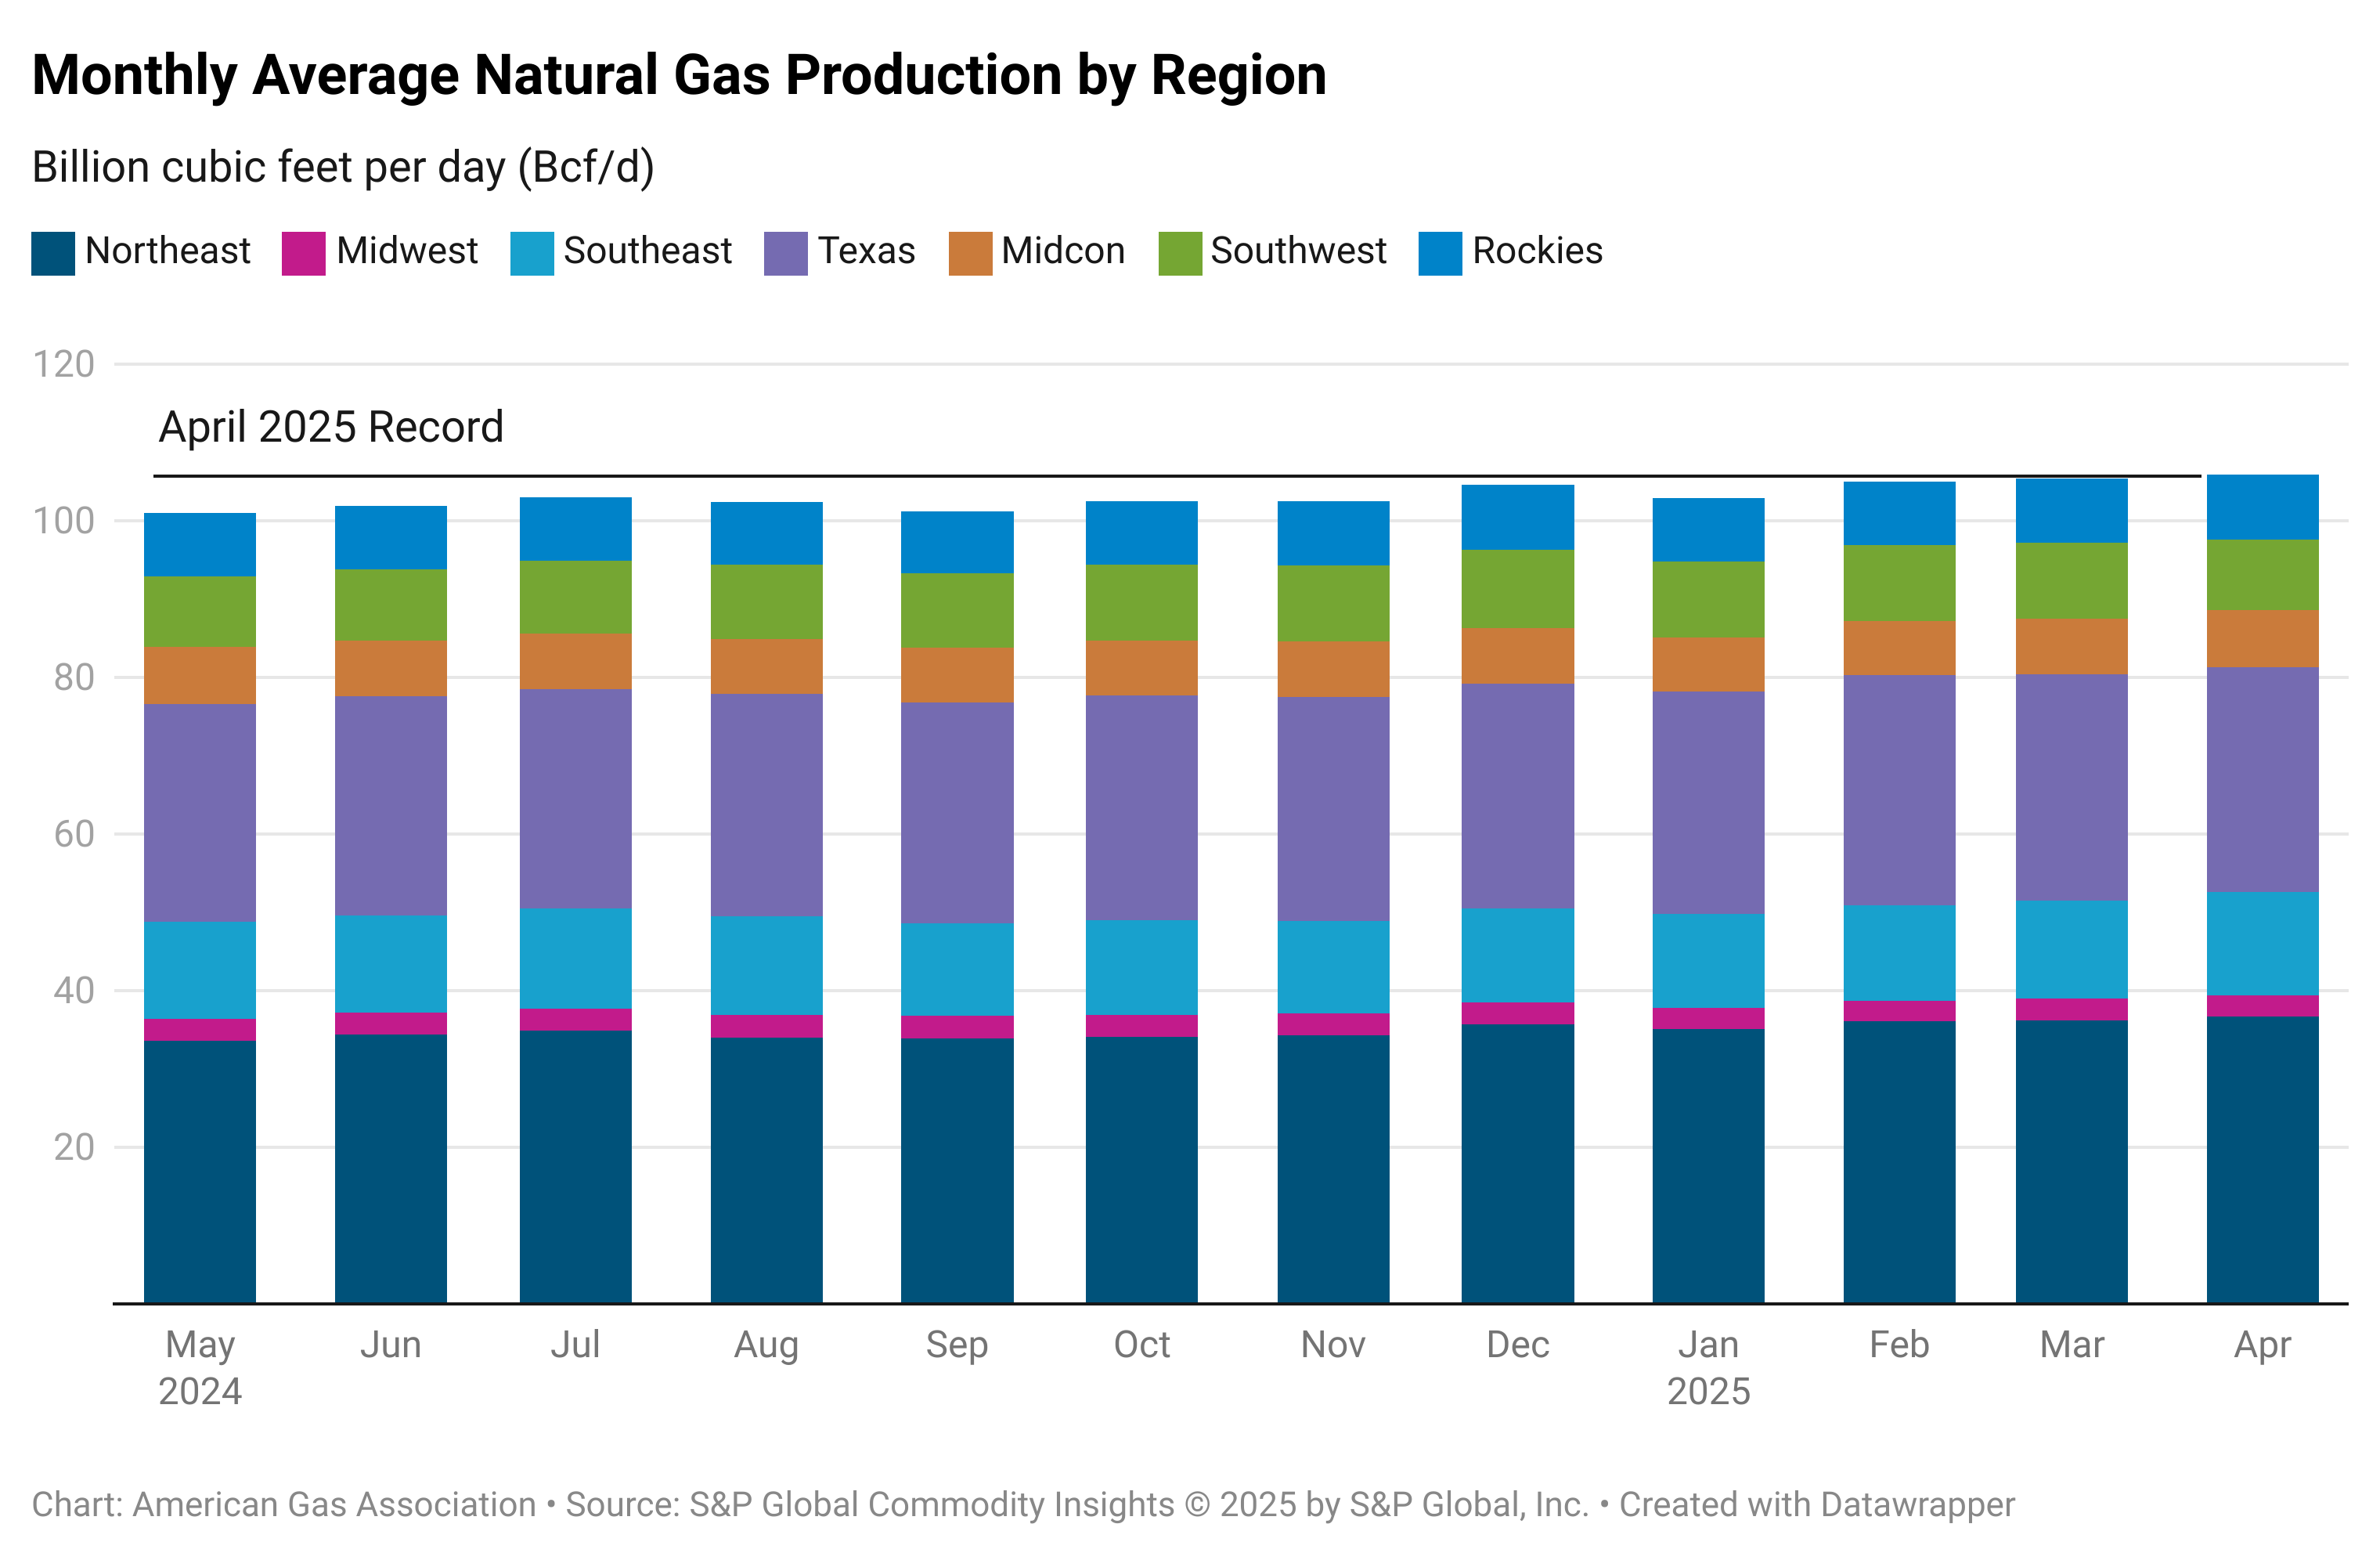
The record-breaking trends of 2025 for the natural gas market continued in April, with dry natural gas production and LNG feedgas deliveries setting new all-time monthly records. Domestic supply for the month exceeded March 2025 by 0.3 percent, according to data from S&P Global Commodity Insights (S&P Global). LNG feedgas deliveries also reached new highs, averaging 16.1 Bcf per day in April, according to Rystad Energy. This is an increase of 1.3 percent over the previous record set in March 2025. Year-over-year, April production and feedgas volumes are up 4.6 percent and 36.4 percent, respectively.
From a pricing perspective, Henry Hub spot prices averaged $3.42 per MMBtu in April, down nearly 17 percent from the March 2025 average. Henry Hub prompt-month prices averaged $3.43 per MMBtu in April, down 16.5 percent from the March 2025 average. Month-to-date as of May 7, prompt month futures are averaging 1.6 percent higher than April. The 12-month strip of $4.25 per MMBtu on May 7 exceeded the June 2025 contract by $0.63 per MMBtu, indicating bullish pricing sentiments ahead in the market as summer cooling demand ramps up and supply-demand balances threaten to tighten.
For example, CNBC reports that the Diamondback Energy CEO warned of declining onshore oil production due to declining crude prices in a May 5 letter to shareholders. U.S. crude oil prices have fallen approximately 17 percent in 2025 amid market uncertainty. Associated gas production from shale plays, such as the Permian Basin, may decline as a result, reducing total supply. At the Waha Hub, prices are showing some early influence, increasing nearly $0.64 per MMBtu in total from May 5 to May 6 according to NGI, a meaningful increase given the Hub is often in negative price territory due to the Permian’s robust production.
Meanwhile, stress on the power grid also supports bullish trends. Ahead of summer, capacity prices in the Midcontinent Independent System Operator (MISO) region jumped to $666.50 per megawatt (MW)-day in its May 5 auction, up from just $30 per MW-day last year, according to Utility Drive. Rising prices are due to plant retirements, reduced imports, and growing industrial demand.
Prices Rise in May on Bullish Market Signals
According to CME, Henry Hub May 2025 futures contracts expired at $3.17 per MMBtu on April 28, a decline of 22 percent since March 28. On the same day, June contracts settled at $3.43 per MMBtu and have since increased to $3.62 per MMBtu as of May 7. Prompt month prices are down 19.4 percent since the 2025-to-date high of $4.49 per MMBtu on March 10.
Short-term movements in the 12-month strip indicate bullish market sentiments. Between April 28 and May 7, 12-month strip prices increased 9.1 percent, driven largely by the transition to the June 2025 contract as the prompt month price following the expiration of the May 2025 contract. In the spot market, the Energy Information Administration (EIA) reports that Henry Hub prices closed at $3.26 per MMBtu on May 5, up 10.1 percent week-over-week.
Mid-May Brings Mixed Temperature Expectations
Weather in the U.S. was the same as last year but 41.7 percent warmer than the 30-year normal for the week ending May 3, according to electric weighted cooling degree days. Regionally, the Middle Atlantic, East North Central, and West South Central were cooler than last year, while the South Atlantic and East South Central were warmer than last year. Other areas experienced similar temperatures year-over-year.
Relative to the 30-year normal, the Middle Atlantic, South Atlantic, East South Central, and West South Central were warmer, while the East North Central, West North Central, Mountain, and Pacific regions were cooler. New England experienced no change relative to the 30-year normal. Looking ahead to mid-May, the National Oceanic and Atmospheric Administration’s temperature outlook for May 15 to 21 is mixed, with much of the western U.S. expected to be below normal while much of the Midwest and East are expected to be above normal.
Demand Up Week-Over-Week, Lags Last Year
As of May 7, total U.S. natural gas demand, including exports, decreased nearly 1 percent week-over-week, according to preliminary data from S&P Global. Average daily domestic demand increased 0.6 percent over the same period, driven by a 2 percent increase in industrial sector demand and 1.6 percent increase in electric power sector demand. By comparison, consumption in the residential and commercial sector fell by 3.3 percent week-over-week. Compared to the same week last year, domestic consumption is down 2 percent. Year-over-year, consumption in the residential and commercial sector is up 12.1 percent, while industrial sector consumption is up 1.7 percent. Natural gas demand in the electric power sector is down 10 percent.
Regionally:
- Week-over-week, domestic consumption increased in the Northeast, Midwest, Midcontinent, and Texas within a range of 1.1 percent to 3.6 percent
- The Northwest posted the largest week-over-week decline of 18.9 percent, followed by the Southeast, Southwest, and Rockies, which posted declines of 1 percent, 0.5 percent, and 1.9 percent, respectively
- Compared to last year, consumption fell in the Southeast, Texas, Northwest, and Rockies with the largest decline of 23.2 percent occurring in the Northwest
- All other regions posted year-over-year increases within a range of 0.5 percent and 6.5 percent
Production Trends Soften in Early May
Domestic natural gas production fell 1.2 percent week-over-week as of May 7, according to preliminary data from S&P Global. Compared to the same week last year, production is up 4.3 percent. Year-over-year, production gains are being driven by an 11.2 percent increase in Northeast production and a 5.8 percent increase in Southeast production. Texas and the Rockies posted smaller year-over-year gains of 0.7 percent and 0.9 percent, respectively, for the week ending May 6, while production declined in the Midwest, Midcontinent, and Southwest by 8.2 percent, 0.8 percent, and 0.9 percent, respectively.
Regional trends for the week ending May 7:
- The Southwest and Northeast posted week-over-week gains of 0.3 percent and 0.2 percent, respectively
- Texas, the Midwest, Southeast, and Rockies posted week-over-week losses ranging from 0.5 percent to 4.4 percent
- Week-over-week production in the Midcontinent remained effectively flat
LNG Terminal Utilization Climbs Despite Dip in Feedgas Flows
According to the EIA, a total of 30 LNG vessels departed from the U.S. for the week ending April 30, with a combined carrying capacity of 115 Bcf. Eighteen vessels, or 60 percent, departed from Sabine Pass, Corpus Christi, and Calcasieu Pass. Compared to the previous week, the total number of departing vessels increased by three, and the total carrying capacity rose by 13 Bcf.
For the week ending May 7, Rystad Energy reports that average daily LNG feedgas flows declined by 1 Bcf per day, or 6.8 percent, from the previous week, averaging a total of 14.8 Bcf per day. According to S&P Global, this short-term dip was primarily driven by reduced supply at Cheniere’s Corpus Christi LNG terminal, coinciding with the start of maintenance at the Sinton Compressor Station this week. While maintenance was expected to limit capacity by approximately 125 MMcf per day, actual feedgas deliveries to Corpus Christi declined by 531 MMcf per day, or 24.7 percent, on May 6 from the day prior, according to data from Rystad Energy.
Despite these movements, Rystad Energy reports that average daily LNG terminal utilization rose by 2 percentage points to 107 percent for the week ending May 7. Year-over-year, both feedgas flows and terminal utilization have seen notable increases. Feedgas flows are up by 3.5 Bcf per day, or 19.8 percent, and LNG terminal utilization has risen by 21 percentage points.
Inventories Exceed Five-Year Average
The EIA reports a net injection of 104 Bcf into underground storage in the lower 48 for the week ending May 2, bringing total working gas stocks to 2,145 Bcf. Storage inventories now stand at 30 Bcf, or 1.4 percent, above the five-year average. Compared to the same week last year, current storage inventories are 16.1 percent lower. Working gas in underground storage exceeded the five-year average the week of April 25 for the first time since January 2025, which was the coldest January in more than three decades according to gas-weighted heating degree days.
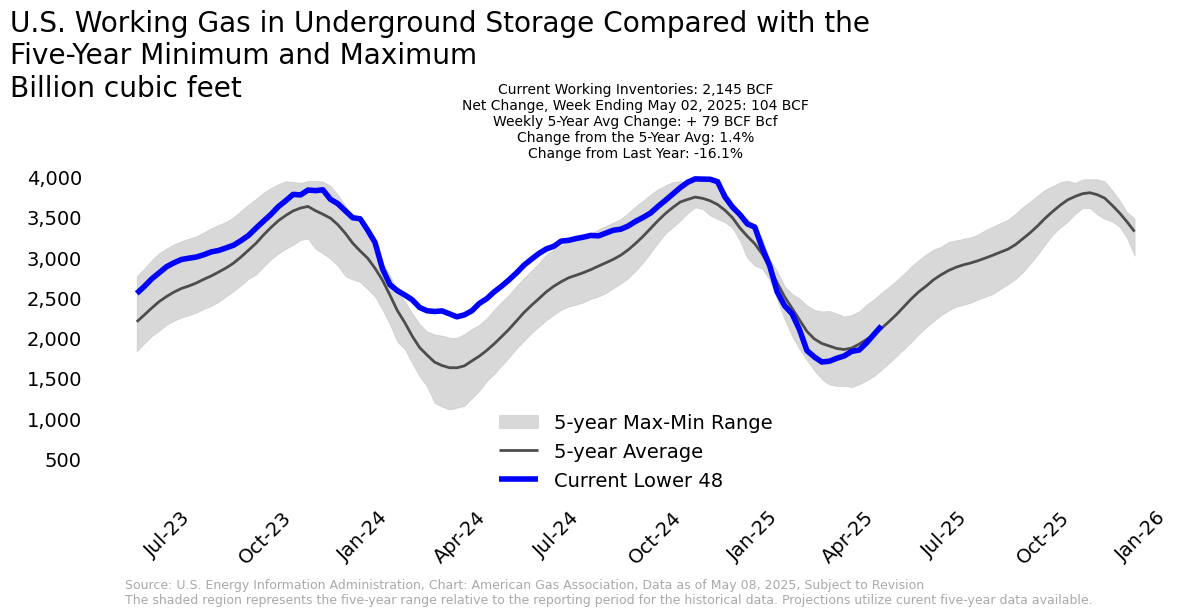
Regionally, all areas posted week-over-week storage injections, with the largest injection of 9.4 percent reported in the East. By comparison, the Pacific posted the smallest injection of 2.7 percent. Currently, only the Mountain and Pacific regions have storage inventories in excess of the five-year average, by 45.2 percent and 17.2 percent, respectively. Other regions are experiencing deficits to the five-year average within a range of 2.1 percent to 5 percent.
Weekly Dip in North American Pipeline Trade
Average daily natural gas imports from Canada fell by 3.2 percent for the week ending May 7, according to preliminary data from S&P Global. Exports to Mexico also declined over this period, falling by 1.5 percent. Year-over-year, Canadian imports are down by 13.5 percent, while exports to Mexico remain up by 4 percent.
Natural Gas Rig Activity Sees Modest Increase
According to Baker Hughes, the total U.S. natural gas rig count increased from 99 to 101 for the week ending May 2. Compared to the same week last year, the number of natural gas rigs is down by one. The total rig count for the week stands at 584, down by 21 rigs, or 3.5 percent, relative to the same period last year. The total count includes 479 oil rigs and four miscellaneous rigs.
What to Watch:
- Production: How will declining onshore crude oil production affect associated gas production and supply-demand balances in the near- to mid-term?
- Storage: Could the potential for production declines affect storage rebuild efforts this refill season?
- Prices: With the 12-month strip trending around $0.70 per MMBtu higher than Henry Hub prompt month prices month-to-date, how much additional upside could natural gas prices realize as other market drivers come into play?
For questions please contact Juan Alvarado | jalvarado@aga.org, Liz Pardue | lpardue@aga.org, or
Lauren Scott | lscott@aga.org
To be added to the distribution list for this report, please notify Lucy Castaneda-Land | lcastaneda-land@aga.org
NOTICE
In issuing and making this publication available, AGA is not undertaking to render professional or other services for or on behalf of any person or entity. Nor is AGA undertaking to perform any duty owed by any person or entity to someone else. Anyone using this document should rely on his or her own independent judgment or, as appropriate, seek the advice of a competent professional in determining the exercise of reasonable care in any given circumstances. The statements in this publication are for general information and represent an unaudited compilation of statistical information that could contain coding or processing errors. AGA makes no warranties, express or implied, nor representations about the accuracy of the information in the publication or its appropriateness for any given purpose or situation. This publication shall not be construed as including advice, guidance, or recommendations to take, or not to take, any actions or decisions regarding any matter, including, without limitation, relating to investments or the purchase or sale of any securities, shares or other assets of any kind. Should you take any such action or decision; you do so at your own risk. Information on the topics covered by this publication may be available from other sources, which the user may wish to consult for additional views or information not covered by this publication.
Copyright © 2025 American Gas Association. All rights reserved.