Natural Gas Market Indicators – October 1, 2026
Natural Gas Market Summary
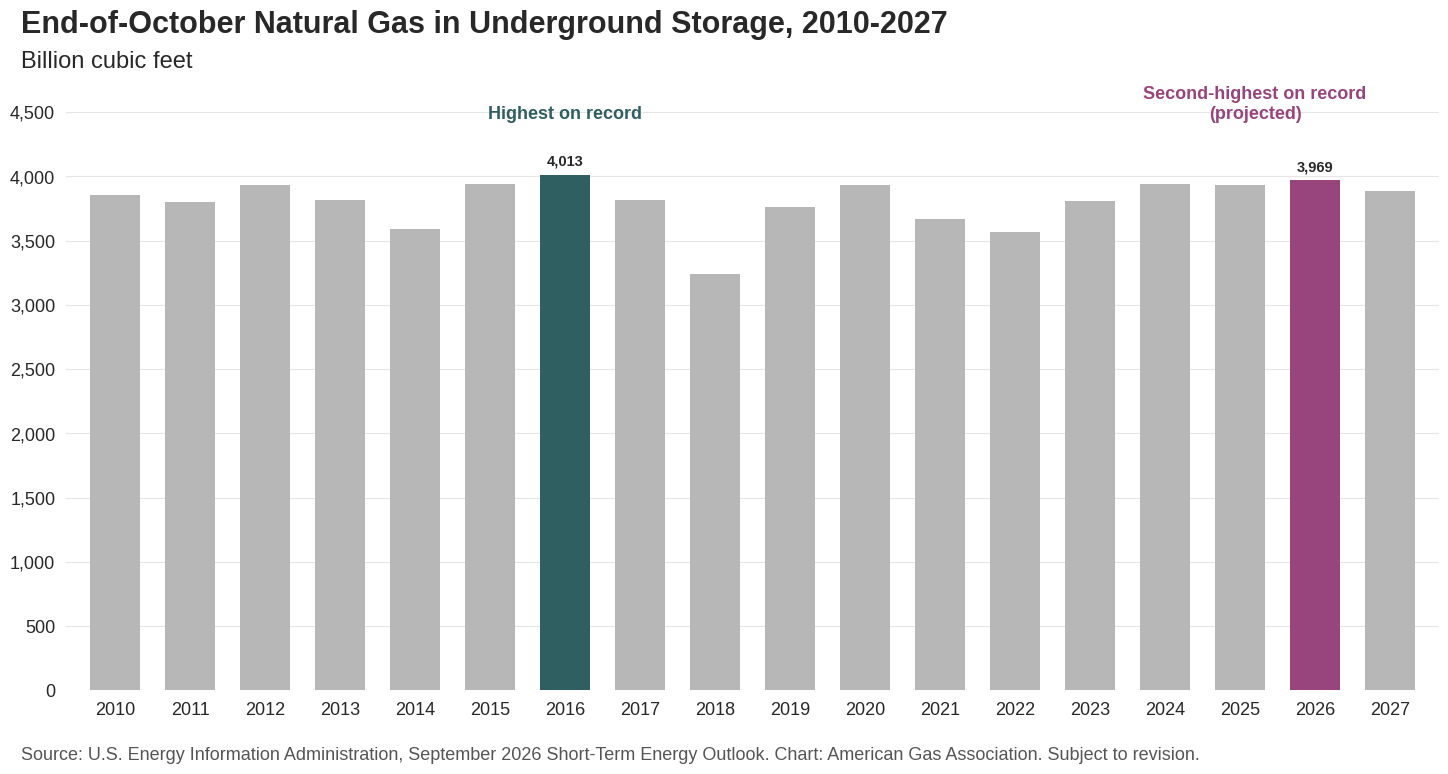
Strong production and high storage inventories are shaping the U.S. natural gas outlook heading into the 2026–2027 winter. In its September Short-Term Energy Outlook (STEO), the U.S. Energy Information Administration (EIA) estimates that underground storage inventories could approach 4 Tcf by the end of October – the second-highest end-of-October inventory level on record. At the same time, dry natural gas production continues to grow, with EIA forecasting output of nearly 112 Bcf per day in 2026. Additional pipeline capacity is supporting this growth, including Energy Transfer’s Hugh Brinson intrastate pipeline, which entered service in June and is expected to ramp up into early 2027. The pipeline would move natural gas from the Permian Basin near the Waha Hub to Maypearl, Texas.
Global markets face a less comfortable outlook. Timera Energy reports that European and Dutch natural gas storage inventories were about 67 percent and 50 percent full, respectively, in mid-September, while continued conflict in the Middle East remains a primary source of energy market uncertainty. Rystad Energy reports that Brent crude oil prices moved above $100 per barrel in mid-September as concerns over regional supply disruptions intensified. While U.S. natural gas markets remain relatively insulated from these developments, Rystad Energy notes that higher global energy prices have contributed to broader inflationary pressures and were a key driver of the Federal Open Market Committee’s September 16 decision to raise its benchmark interest rate by 25 basis points to a range of 3.75–4 percent. Higher borrowing costs could, in turn, weigh on economic activity and energy demand.
For more on the 2026-2027 winter heating season, check out the AGA Analysis team’s Winter Heating Outlook.
Summer Henry Hub Spot Prices 6% Lower Year-over-Year
After more than two months below $3, Henry Hub prompt-month prices settled at $3.02 per MMBtu on September 23 amid lingering late-summer heat. Prices remained near that threshold through the October contract expiration and the transition to the November prompt-month contract. Futures settled at $3.03 per MMBtu on September 30 and edged slightly lower in intraday trading as of the time of this writing.
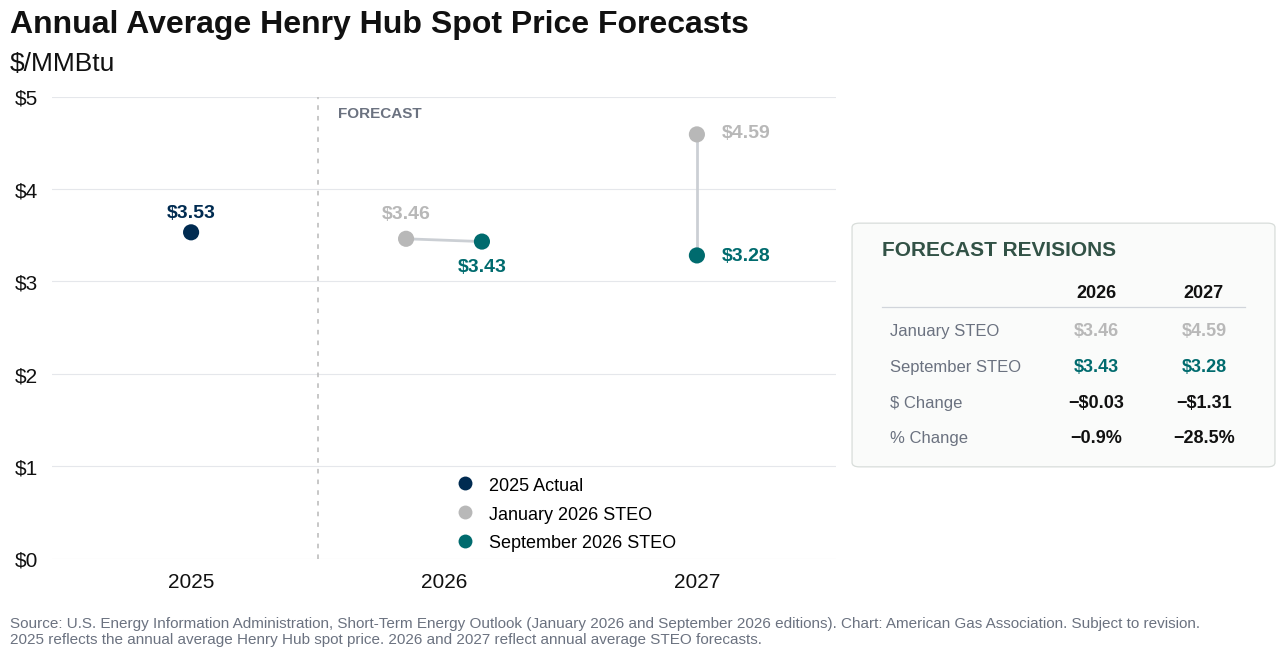
The broader theme of relatively modest natural gas prices continues. The EIA reports that inflation-adjusted Henry Hub spot prices averaged $2.93 per MMBtu from June through August 2026, 6 percent lower than prices last summer, as record natural gas production and ample inventories helped moderate pricing. Looking ahead, the EIA revised its average spot price outlook slightly lower in the September STEO to $3.43 per MMBtu in 2026 and $3.28 per MMBtu in 2027, decreases of 0.3 percent and 1 percent, respectfully, from the previous forecast. The 2027 shift is much more pronounced when considering earlier forecasts. The September price outlook for 2027 is nearly 29 percent below the $4.59 per MMBtu average projected in the January STEO.
Early October Outlook Favors Warmer Conditions Across the West, Cooler Northeast
For the week ending September 26, temperatures across the U.S. were 22.2 percent cooler than last year but 25.0 percent warmer than the 30-year normal weighted by electric home air conditioning customers. All regions were cooler than last year except the East and West South Central. Compared with the 30-year normal, however, all regions were warmer except the Middle Atlantic, East North Central, Mountain, and New England.
Looking ahead, the National Oceanic and Atmospheric Administration’s (NOAA) 8–14-day outlook for October 7–13 favors above-normal temperatures across much of the western U.S. and Florida, with the strongest probabilities across parts of the West. Below-normal temperatures are favored across portions of the Northeast, while much of the central and southeastern U.S. is expected to experience near-normal conditions. The outlook suggests relatively limited early-season heating demand across much of the country, although cooler conditions in the Northeast could support stronger heating-related natural gas demand in the region.
Notably, the 2026 Atlantic hurricane season has yet to produce a hurricane, marking the first time since 1914 that the basin has reached this point in the season without hurricane-level storm activity according to NOAA historical records. NOAA’s National Hurricane Center is monitoring several tropical systems in the Pacific basins. Hurricane Rachel and Tropical Depression Nineteen-E are active in the eastern Pacific, while Tropical Storm Nolo is active in the central Pacific. There are currently no active tropical cyclones in the Atlantic, and no tropical cyclone formation is expected there during the next seven days. None of the active systems pose a direct threat to U.S. Gulf Coast natural gas or LNG infrastructure.
Monthly Average Demand Up Year-Over-Year
Total natural gas demand, including exports, declined modestly in September compared to August. Total demand fell 3.5 percent relative to August, according to preliminary data from S&P Global Energy. The decline was driven by a 5.7 percent reduction in domestic demand as temperatures moderated during the shoulder season. In contrast, pipeline exports and LNG feedgas demand increased 1.6 percent month-over-month.
Despite the overall monthly decline, year-over-year trends show strong demand growth both at home and abroad. Total demand was 5.0 percent higher in September compared to the same month in 2025. Domestic consumption and exports were both higher, up 2.8 percent and 10.1 percent, respectively. Domestic demand growth was driven primarily by the electric power and industrial sectors, which are up 4.7 percent and 0.6 percent, respectively, compared to September 2025.
Production Reaching New Records
Domestic dry natural gas production remains strong year-over-year as the third quarter comes to a close. Output reached a new daily record on September 17, following a series of new records since late July, according to preliminary data from S&P Global Energy. Year-to-date through September 30, production is running nearly 4 percent higher than year-ago levels. Much of the growth is concentrated in the Permian Basin and Haynesville play as associated gas volumes rise and gas-directed drilling remains elevated.
In the September 2026 STEO, the EIA increased its average 2026 production estimate by 0.5 percent to 111.7 Bcf per day, noting that the Permian and Haynesville regions make up more than 70 percent of the production growth forecast.
Feedgas Deliveries Rise in September
After planned summer maintenance at several LNG export facilities, U.S. feedgas deliveries are recovering in September. For the month, feedgas flows averaged 18.0 Bcf per day, increasing by 4.4 percent, or roughly 0.8 Bcf per day, compared to the same period in August, according to preliminary data from Rystad Energy. The recovery comes as global LNG markets remain tight amid continued geopolitical tension in the Middle East. Since the start of the conflict in late February, European and Asian natural gas prices have risen sharply. Between the weeks ending February 22 and September 27, European TTF futures increased approximately 127 percent, with the weekly average rising from $10.78 to $24.49 per MMBtu, while Asian JKM futures increased about 145 percent, from a weekly average of $10.63 to $26.08 per MMBtu. Over the same period, the weekly average for U.S. Henry Hub futures increased just 7 percent, from $2.89 to $3.11 per MMBtu.
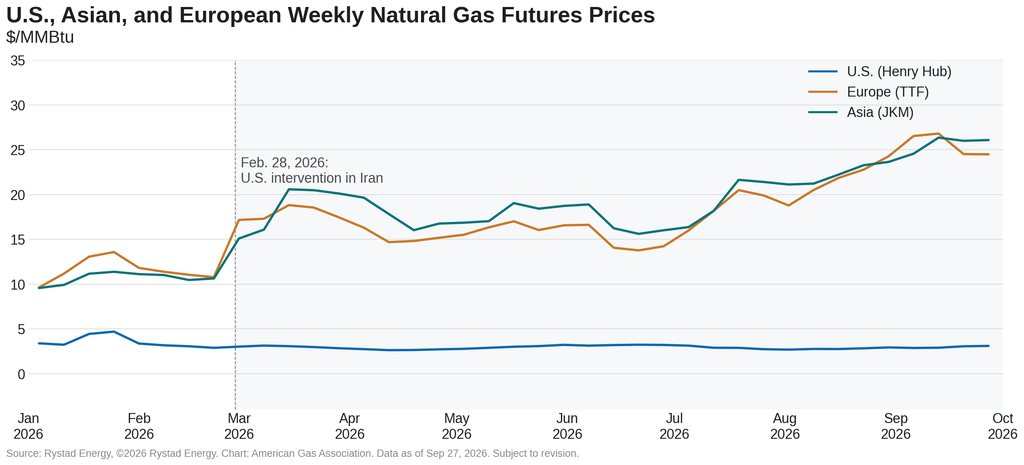
The divergence reflects the greater exposure of European and Asian markets to global disruptions. U.S. LNG remains an important source of cargoes to both regions, particularly as Europe enters the final weeks of the storage injection season with below-average inventories and Europe and Asia continue to compete for available LNG supply ahead of winter.
In other LNG news:
- Corpus Christi LNG completed its Stage 3 liquefaction project on August 28, increasing total peak liquefaction capacity by 1.5 Bcf per day to 3.9 Bcf per day.
- LNG Canada announced it will proceed with Phase 2 of its British Columbia export facility, which will add two liquefaction trains and double production capacity from 14 million to 28 million metric tons per year. Commercial operations are expected to begin in the early 2030s.
Storage Surplus Shrinks on Modest Weekly Injection
The EIA reported a net injection of 64 Bcf into underground storage inventories for the week ending September 25, bringing total lower 48 working gas inventories to 3,415 Bcf. This marks the first week since late July that the weekly storage build exceeded the corresponding year-ago increase, and the seventh consecutive week of net injections below the five-year average build. These smaller-than-average weekly injections have led to a shrinking storage surplus. For the week, inventories stand 2.4 percent higher than the five-year average but nearly 4 percent below year-ago levels. Regionally, South Central inventories are below both benchmarks, particularly in salt storage, where stocks are 15.5 percent below the five-year average and 27.3 percent below year-ago levels.
Despite softer weekly trends, the EIA expects underground natural gas storage inventories to be the second-highest on record at the end of October. The September STEO updated its storage outlook to reach nearly 4 Tcf by the end of October, 44 Bcf below the all-time high set in October 2016.
Mexico Pipeline Exports Remain Elevated After Record August
U.S. pipeline exports to Mexico reached record levels in August, with the monthly average setting a new all-time high and daily exports also reaching a record on August 26, according to preliminary data from S&P Global Energy. In September, exports remained elevated, posting the highest September average on record and increasing 8.8 percent from September 2025.
Canadian pipeline imports also increased in September but remained well below historical highs. Imports rose 1.3 percent from August and 11.3 percent from a year earlier.
Haynesville Driving Year-over-Year Increase in Gas-Directed Drilling Activity
According to Baker Hughes, the total U.S. rig count increased by four for the week ending September 25, driven by an increase of three oil-directed rigs and one natural gas-directed rig. Compared to year-ago levels, the total rig count is 9.1 percent higher, a difference of 50 rigs.
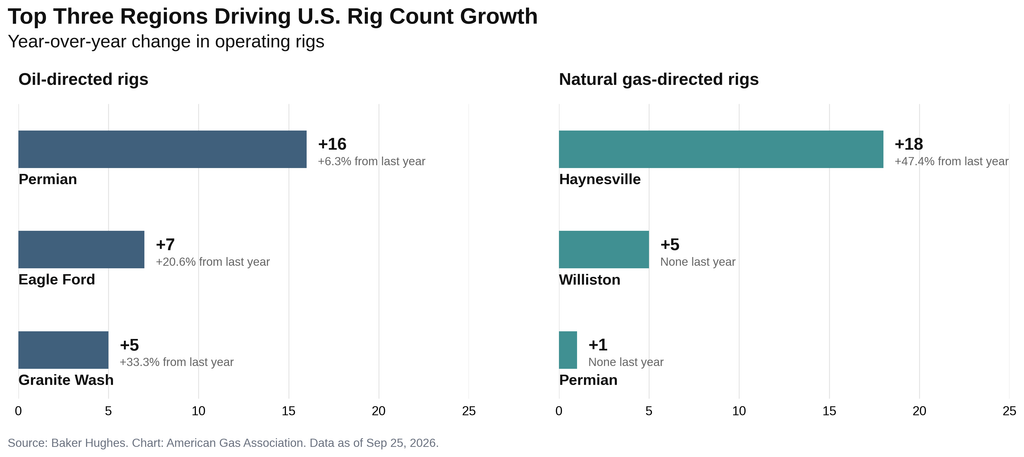
Gas-directed rigs continue to exhibit the largest percentage change – up 15.4 percent year-over-year, an increase of 18 rigs – while oil-directed rigs have risen by 31, an increase of 7.3 percent. Growth remains concentrated in a handful of major producing regions. The Haynesville play accounts for the largest year-over-year increase in gas-directed drilling, with 18 additional rigs, while oil-directed gains have been led by the Permian (+16 rigs), Eagle Ford (+7 rigs), and Granite Wash (+5 rigs). By state, Texas and Oklahoma have accounted for much of the increase in oil-directed activity, while Texas has been the primary driver of higher gas-directed drilling.
What to Watch:
- Production: How might elevated Brent crude oil prices support domestic associated natural gas production?
- LNG: Could the widening gap between Henry Hub and international LNG prices encourage U.S. export facilities to run near maximum utilization in the near term?
- Demand: Could inflation and higher borrowing costs temper expected growth in U.S. industrial natural gas demand?
For questions please contact Juan Alvarado | jalvarado@aga.org, Liz Pardue | lpardue@aga.org, or Lauren Scott | lscott@aga.org
To be added to the distribution list for this report, please notify Lucy Castaneda-Land | lcastaneda-land@aga.org
Notice
In issuing and making this publication available, AGA is not undertaking to render professional or other services for or on behalf of any person or entity. Nor is AGA undertaking to perform any duty owed by any person or entity to someone else. Anyone using this document should rely on his or her own independent judgment or, as appropriate, seek the advice of a competent professional in determining the exercise of reasonable care in any given circumstances. The statements in this publication are for general information and represent an unaudited compilation of statistical information that could contain coding or processing errors. AGA makes no warranties, express or implied, nor representations about the accuracy of the information in the publication or its appropriateness for any given purpose or situation. This publication shall not be construed as including advice, guidance, or recommendations to take, or not to take, any actions or decisions regarding any matter, including, without limitation, relating to investments or the purchase or sale of any securities, shares or other assets of any kind. Should you take any such action or decision; you do so at your own risk. Information on the topics covered by this publication may be available from other sources, which the user may wish to consult for additional views or information not covered by this publication
Data Disclaimer Notice: S&P Global Energy
Reproduction of any information, data or material, including ratings (“Content”) in any form is prohibited except with the prior written permission of the relevant party. Such party, its affiliates and suppliers (“Content Providers”) do not guarantee the accuracy, adequacy, completeness, timeliness, or availability of any Content and are not responsible for any errors or omissions (negligent or otherwise), regardless of cause, or for the result obtained from the use of such Content. In no event shall Content Providers bed liable for any damages, costs, expenses, legal fees, or losses (including lost income or lost profit and opportunity costs) in connection with any use of the Content. A reference to a particular investment or security, a rating or any observation concerning an investment that is part of the Content is not a recommendation to buy, sell or hold such investment or security, does not address the suitability of an investment or security and should not be relied on as investment advice. Credit ratings are statements of opinions and are not statement of fact.
Copyright © 2026 American Gas Association. All rights reserved.Natural Gas Market Indicators – July 9, 2026