Natural Gas Market Indicators – September 3, 2026
Natural Gas Market Summary
U.S. natural gas supply-demand balances remained relatively stable through August, as record production largely kept pace with stronger LNG exports and weather-driven demand. Storage inventories increased by 30 Bcf for the week ending August 28 and remained above the five-year average. Against this backdrop, Rystad Energy’s August 2026 North America Gas Market Report (August Market Report) raised its total demand outlook, including exports, by 0.1 percent from its July forecast while leaving projected domestic consumption unchanged. Henry Hub prompt-month futures moved closer to $3 per MMBtu, while the narrowing gap between the prompt-month contract and the 12-month strip suggests that near-term supply-demand conditions may be exerting greater influence on prices ahead of the winter heating season.
Globally, winter supply risks remain elevated as the conflict in Iran continues to disrupt LNG trade flows. Asia and Europe remain in competition for cargoes as the European Union (EU) seeks to replenish storage ahead of winter. EU inventories remained below the five-year minimum and were 65.4 percent full as of August 30.
Forward Curve Flattens as Winter Approaches
As the end of the cooling season approaches, futures markets are increasingly tied to winter demand expectations. On the first trading day of August, the September 2026 Henry Hub contract settled at $2.78 per MMBtu. By expiration on August 27, the contract had risen to $2.91 per MMBtu. Following the rollover, the October 2026 contract became the prompt month and settled at $2.96 per MMBtu on September 2.
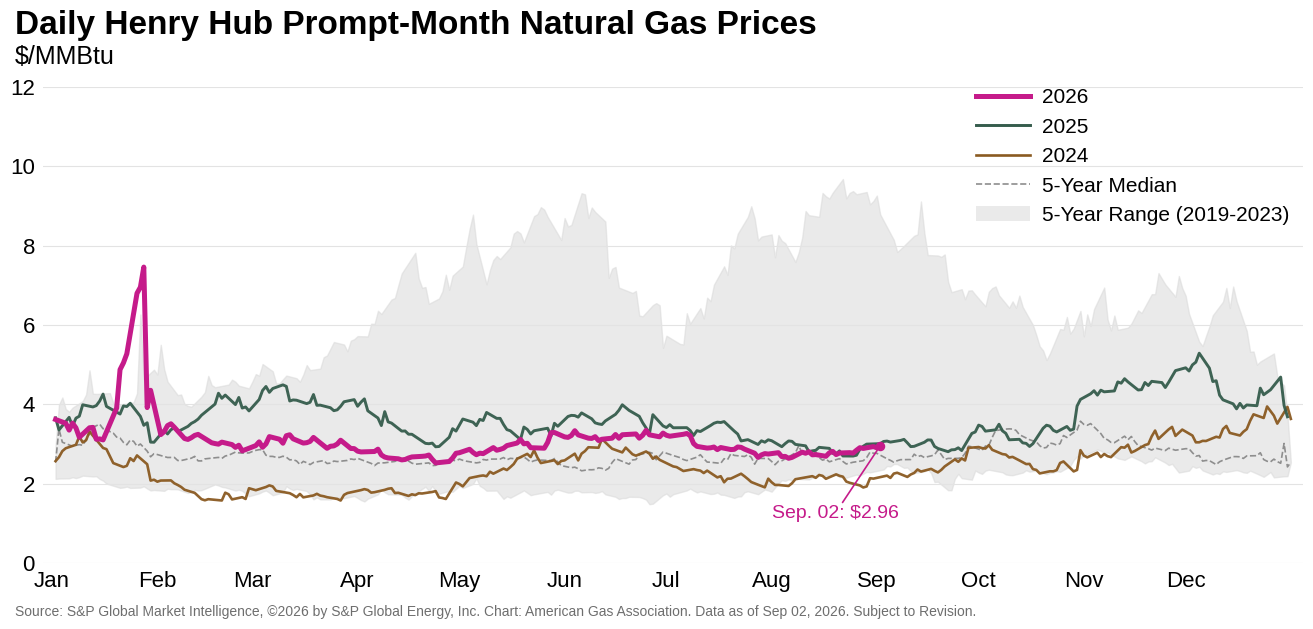
While prompt-month prices strengthened over the month, prices across the 12-month futures strip moved lower. Average strip settlements declined 0.9 percent from $3.22 per MMBtu on August 3 to $3.19 per MMBtu on September 2. Over the same period, the spread between prompt-month prices and the 12-month strip narrowed from $0.43 per MMBtu to $0.23 per MMBtu. This compression reflects a flattening forward curve, as prices for near-term delivery strengthened relative to contracts in later months.
Heat Dome Persists into September
The spree of persistent heat domes continues as September begins. Dr. Ryan Maue reports that a heat dome remains anchored over the Central Plains, with above-average temperatures potentially lasting into September 12. Parts of the Central U.S., including Oklahoma, Kansas, and Arkansas, reached triple-digit temps over the last week, with overnight lows expected to be up to 20 degrees above average in some areas. In the Gulf, Tropical Storm Edouard offers some reprieve to coastal states as it moves to make landfall in Texas. Beyond the heat, the broader atmospheric pattern is also contributing to higher storm risks along the periphery of the high-pressure dome, increasing flooding and severe-weather risks across portions of the Great Lakes and Northeast.
Nationally, the last full week of August was nearly 44 percent warmer than last year and 21.1 percent warmer than the 30-year normal, according to cooling degree day data weighted by electric home air conditioning customers. Probabilities for above-normal temperatures – particularly in the Southeast, Mid-Atlantic, and Midwest – suggest the warmer-than-normal pattern could continue into mid-September, according to forecasts from the National Oceanic and Atmospheric Administration (NOAA). The West Coast, Rockies, and northern New England are expected to experience near-normal temperatures during this time.
Tropical weather activity has remained fairly limited during the 2026 Atlantic hurricane season so far. Tropical Storm Dolly formed briefly over the central Atlantic in late August before dissipating, while Tropical Storm Edouard formed in the Gulf and gained strength as it moved northwest toward Texas, prompting wind, storm surge, rainfall, and tornado advisories in coastal Texas and Louisiana. The storm made landfall on September 2 and weakened rapidly into a tropical depression. At the time of this writing, NOAA’s National Hurricane Center is monitoring three hurricanes in the Pacific. No coastal advisories have been issued for these storms.
Natural Gas Demand Higher on Strong LNG Exports
Natural gas demand remains elevated as summer winds down. Preliminary data from Rystad Energy indicates that August total natural gas demand, including exports, edged slightly higher than July levels and rose by 5.5 percent year-over-year. For the year to date, total demand, including exports, is nearly 3 percent higher than the same period in 2025, supported by growing LNG exports and power sector consumption.
Domestic natural gas consumption was effectively flat month-over-month as modest gains in residential, commercial, and industrial demand offset a 0.5 Bcf per day decline in power sector demand relative to July. Compared to last year, August consumption rose 5.1 percent, driven by a 3.7 Bcf per day increase in power sector demand.
Production Sets New Records
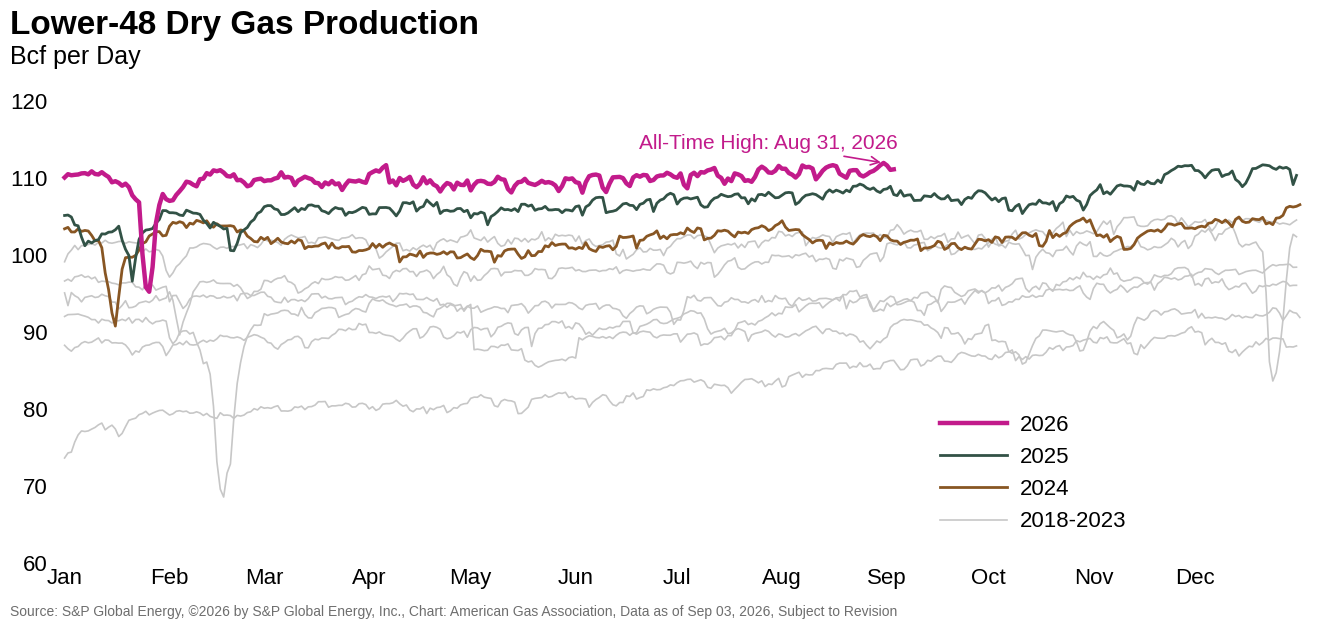
Domestic natural gas production continues to reach new highs as supply expands to meet growing demand. According to preliminary data from S&P Global Energy, total dry gas production reached a new all-time monthly record this August, rising 0.2 percent over the previous December 2025 record. Production also established a new daily record on August 31, exceeding the prior high reached on the December 21, 2025, by 0.2 percent. Rystad Energy’s August Market Report attributes the elevated production levels to increased producer hedging activity and continued output growth among private operators.
U.S. LNG Exports Gain Ground
U.S. LNG feedgas deliveries are maintaining year-over-year strength amid heightened LNG export demand and increasing domestic liquefaction facility capacity. Feedgas volumes averaged 17.3 Bcf per day in August, essentially flat compared to July volumes but 8.4 percent higher than the same month last year, according to preliminary data from Rystad Energy. For the year-to-date through the end of August, volumes are 2.5 Bcf per day higher on average than the same period in 2025, an increase of 16.4 percent.
According to EIA analysis, U.S. LNG exports averaged 17.4 Bcf per day during the first half of 2026, up 23 percent from a year earlier, supported by the ramp-up of Plaquemines LNG and Corpus Christi Stage 3 and the startup of Golden Pass. Strong international pricing and supply disruptions also kept demand for U.S. cargoes firm, particularly in Asia, where U.S. LNG shipments more than doubled year-over-year. Through June 2026, the average price at the Dutch Title Transfer Facility (TTF) reached $14.74 per MMBtu, 12.5 percent higher than the same period last year and the highest price since the 2022 Russian invasion of Ukraine. The average Japan Korea Marker (JKM) rose to $15.56 per MMBtu over the same period, an increase of more than 18 percent. EIA expects exports to remain near current levels through the second half of 2026 before climbing further as additional capacity enters service.
Regional Storage Trends Diverge
For the week ending August 28, the EIA reported a net injection of 30 Bcf into lower 48 underground storage, raising total working gas stocks to 3,214 Bcf. Storage inventories now stand 5.2 percent above the five-year average, and just 1.5 percent, or 48 Bcf, below year-ago levels. Despite the modest year-over-year decline, inventories remain historically strong, sitting just 133 Bcf below the five-year maximum of 3,347 Bcf.
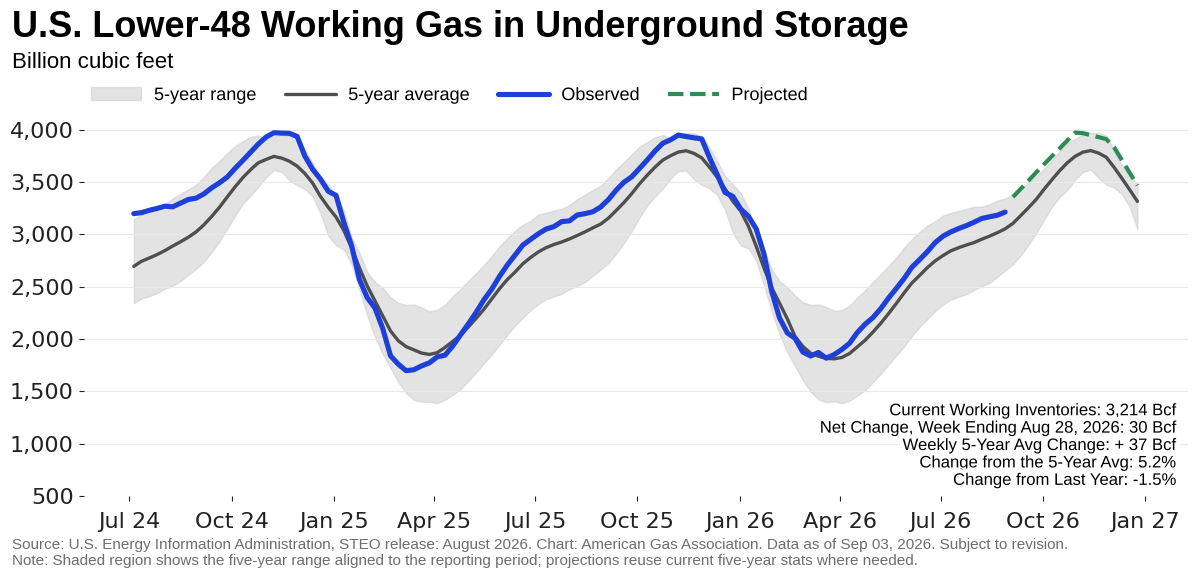
Regional trends were mixed. The East and Midwest reported net injections of 26 Bcf and 24 Bcf, respectively, while the South Central, Pacific, and Mountain regions posted net withdrawals of 10 Bcf, 8 Bcf, and 2 Bcf. The regional divergence likely reflects differences in late-summer demand and storage activity, with warmer conditions continuing to support demand in parts of the central and western U.S.
Despite withdrawals in several regions, inventories across all major storage regions remain above their respective five-year averages. Surpluses above the regional five-year average range from 2.8 percent in the South Central region to 8.8 percent in the Mountain region.
August Cross-Border Pipeline Flows Mixed
Natural gas cross-border pipeline trade was mixed in August, with exports to Mexico rising while imports from Canada fell. Pipeline imports from Canada averaged 4 Bcf per day in August, declining more than 8 percent month-over-month and by 9.5 percent compared to year-ago levels, according to preliminary data from Rystad Energy. By comparison, natural gas exports to Mexico averaged 6.5 Bcf per day for the month, rising 3.2 percent and nearly 6 percent, respectively. On a year-to-date basis, exports to Mexico are up more than 5 percent while Canadian imports are down 14.1 percent.
Rig Count Remains Flat Week-Over-Week
For the week ending August 28, the total U.S. rig count remained unchanged at 588 active rigs, according to Baker Hughes. A five-rig increase in natural gas-directed rigs fully offset a week-over-week decline of five oil-directed rigs. Compared to the same period last year, total rig count is 9.7 percent higher, reflecting growth in both oil- and natural gas-directed drilling activity, which have increased 8.5 percent and 10.9 percent, respectively.
What to Watch:
- Storage: Will persistent heat domes affect storage injection expectations as the fall shoulder season approaches?
- Prices: Could Henry Hub sustain a move above $3 per MMBtu if late-summer heat persists, or will ample supply dynamics continue to cap upside?
- Production: Can U.S. dry gas production sustain its recent record pace into the fall, particularly if prices remain relatively modest?
For questions please contact Juan Alvarado | jalvarado@aga.org, Liz Pardue | lpardue@aga.org, or Lauren Scott | lscott@aga.org
To be added to the distribution list for this report, please notify Lucy Castaneda-Land | lcastaneda-land@aga.org
Notice
In issuing and making this publication available, AGA is not undertaking to render professional or other services for or on behalf of any person or entity. Nor is AGA undertaking to perform any duty owed by any person or entity to someone else. Anyone using this document should rely on his or her own independent judgment or, as appropriate, seek the advice of a competent professional in determining the exercise of reasonable care in any given circumstances. The statements in this publication are for general information and represent an unaudited compilation of statistical information that could contain coding or processing errors. AGA makes no warranties, express or implied, nor representations about the accuracy of the information in the publication or its appropriateness for any given purpose or situation. This publication shall not be construed as including advice, guidance, or recommendations to take, or not to take, any actions or decisions regarding any matter, including, without limitation, relating to investments or the purchase or sale of any securities, shares or other assets of any kind. Should you take any such action or decision; you do so at your own risk. Information on the topics covered by this publication may be available from other sources, which the user may wish to consult for additional views or information not covered by this publication
Data Disclaimer Notice: S&P Global Energy
Reproduction of any information, data or material, including ratings (“Content”) in any form is prohibited except with the prior written permission of the relevant party. Such party, its affiliates and suppliers (“Content Providers”) do not guarantee the accuracy, adequacy, completeness, timeliness, or availability of any Content and are not responsible for any errors or omissions (negligent or otherwise), regardless of cause, or for the result obtained from the use of such Content. In no event shall Content Providers bed liable for any damages, costs, expenses, legal fees, or losses (including lost income or lost profit and opportunity costs) in connection with any use of the Content. A reference to a particular investment or security, a rating or any observation concerning an investment that is part of the Content is not a recommendation to buy, sell or hold such investment or security, does not address the suitability of an investment or security and should not be relied on as investment advice. Credit ratings are statements of opinions and are not statement of fact.
Copyright © 2026 American Gas Association. All rights reserved.Natural Gas Market Indicators – July 9, 2026