Natural Gas Market Indicators – Special Edition
Summary
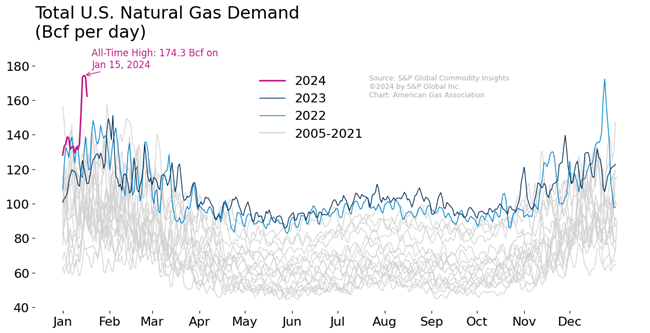
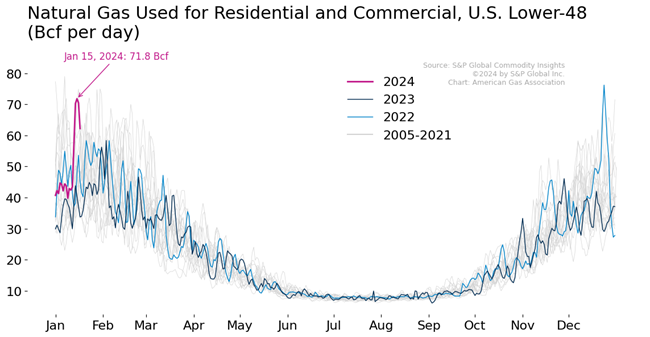
- Record-breaking Natural Gas Demand: The U.S. has experienced record-breaking natural gas demand, with consumption reaching 174.3 Bcf on January 15, 2024, as per S&P Global Commodity Insights. This peak in demand, including pipeline exports and LNG feedgas, surpasses the previous record set in December 2022 during Winter Storm Elliot. Residential and commercial usage also surged, with a significant 80% increase in volumes delivered in just six days, reflecting the intensity of the cold and the system response to meet heating loads.
- Increased Reliance on Natural Gas for Power Generation: The U.S. power sector’s utilization of natural gas reached unprecedented winter levels in January 2024. Estimated natural gas volumes for power generation hit 45.4 Bcf on January 16, surpassing the previous winter record set in December 2022. On January 15, natural gas accounted for 40% of all electricity generation in the lower-48 states, with natural gas, coal, and nuclear power comprising 81.6% of total electricity generated.
- Natural Gas Production Declines Amid Market Flexibility: U.S. natural gas production has fallen to 92 Bcf per day, a 9% decrease from the previous week, largely due to cold weather impacting dry gas flows. The decline in production varied across regions, with Texas experiencing an 11% drop. Market flexibility was observed through increased Canadian pipeline imports, reduced LNG feedgas demand, and heightened storage withdrawals. Amidst, Henry Hub cash prices jumped as high as $15 per MMBtu, but then quickly retreated into the $3-4 range by Wednesday, January 17.
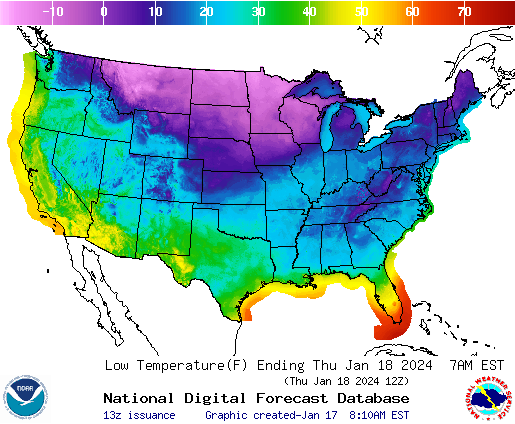
Extreme cold continues
Below-zero temperatures reached for much of the country this week, pushing as far south as Tulsa and Amarillo and east through Missouri and Illinois. Apparent wind chill temperatures dropped even to the Mexican border and eastward through Appalachia. By Wednesday, temperatures have begun to ease, Temperatures should start to ease, but wind chill advisories still persist in the mid-continent and through the Midwest. The Pacific Northwest into Montana and Wyoming have winter storm warnings in place. Another burst of cold is expected through the weekend but may be less severe. Toward the end of January, forecasts suggest milder patterns that may bring an easing of temperatures.
Total U.S. natural gas demand hit a new record on January 15, 2024, according to preliminary estimates from S&P Global Commodity Insights. Total natural gas consumption, including pipeline exports and feedgas for LNG, reached 174.3 Bcf on January 15, 2024. In fact, estimated demand on January 14, 15, and 16 all look to exceed the prior record set in December 2022 during Winter Storm Elliot.
Residential and commercial natural gas climbed rapidly, reaching 71.8 Bcf on Monday, January 15. U.S., according to data from S&P Global Commodity Insights. Volumes delivered increased 80% from only six days prior, showing the severity of the cold and the subsequent system response as heading loads rose sharply.
The U.S. power sector is using more natural gas in January than ever before so far this month. Estimated volumes for January 16, 2024 hit 45.4 Bcf, exceeding the prior record set in December 2022.
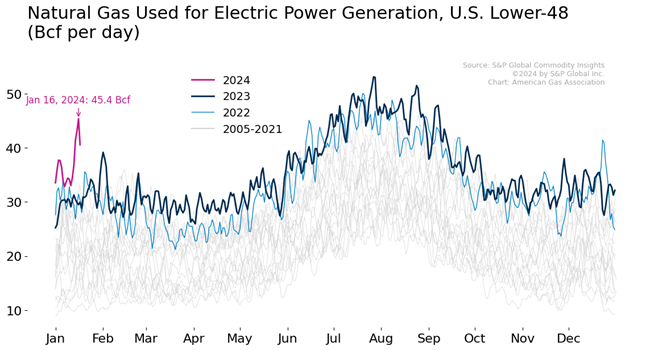
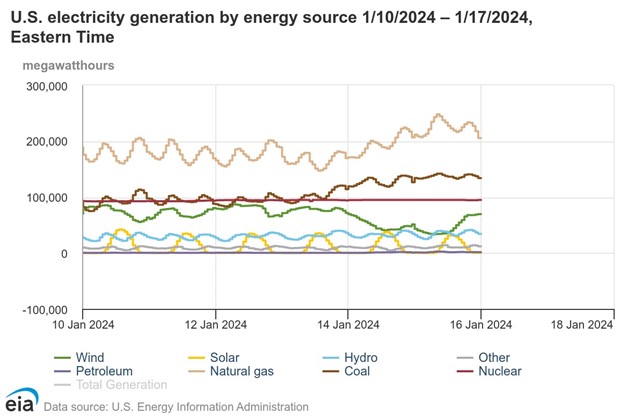
Natural gas generation accounted for 40% of all U.S. lower-48 electricity generation on January 15, 2024, according to the EIA Hourly Grid Monitor. In fact, the share of natural gas generation grew as overall demand climbed in response to the cold temperatures. Natural gas, coal, and nuclear were 81.6% of all electricity generated on January 15.
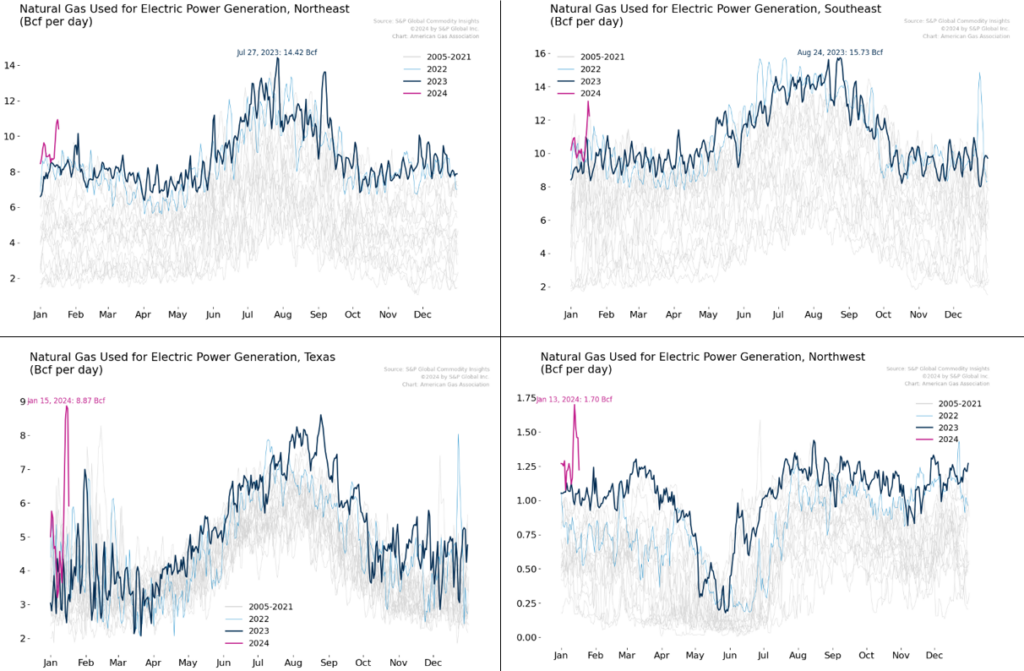
Regional natural gas demand for electric power is rising in many areas. The Pacific Northwest (Oregon, Washington, and Idaho collectively) set a record high for natural gas used for power generation on January 13, 2024. Volumes fell the following day, possibly due to the critical notices issued on the Northwest pipeline, which may have induced lower demand.
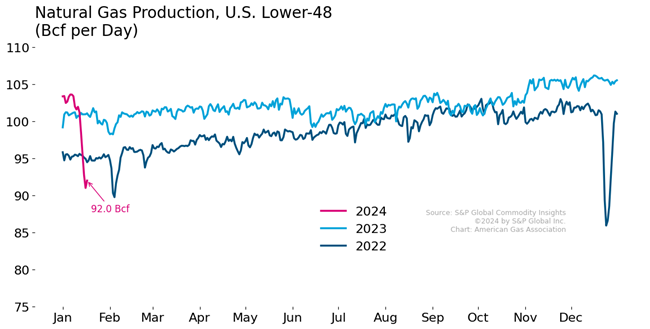
U.S. natural gas production has declined to 92 Bcf per day, with the cold weather affecting dry gas flows in several production areas with flowing gas at wellheads becoming blocked as water and other liquids in the gas mixture freeze. Current volumes are 9% below week-ago levels. Production volumes will likely increase as temperatures ease.
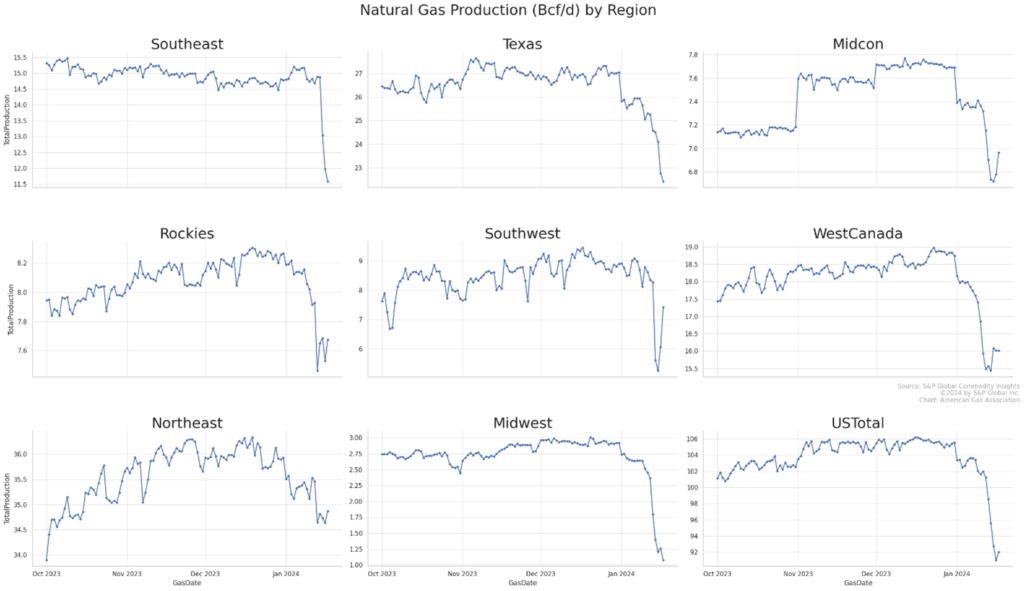
Regional production has declined in most major producing areas but varies depending on the depth of the cold. Northeast production has declined only 0.7%, and Texas dropped by 11%. Notably, Texas production declined only modestly from Monday into Tuesday even as temperatures continued to drop. However, the cold has been more impactful in other regions with week-over-week declines in the Rockies (-4%), the Southwest (-16%), the Midwest (-57%), and the Midcontinent (-5%).
There was notable market flexibility coming from increases in Canadian pipeline imports, declines in LNG feedgas, and increases in storage withdrawals. Canadian import volumes rose as much as 84 percent between January 11 and 16. Feegas demand for LNG exports declined during the peak of the cold, with daily volumes dropping 37% from January 11 to 16. Finally, storage withdrawals accounted for nearly 40% of total U.S. demand on January 15 and 16, based on daily data and implied storage withdrawals from S&P Global Commodity Insights.
Henry Hub cash prices closed above $13 per MMBtu and traded as high as $15.20 per MMBtu ahead of the holiday weekend. May daily spot price indices jumped into double-digit territory as buyers sought gas supplies headed into the long and cold weekend. However, prices retreated as markets re-opened, and by Wednesday day-ahead Henry Hub prices had fallen to $3.25 per MMBtu.
Please note all data is preliminary and subject to revision.
For questions please contact Richard Meyer | rmeryer@aga.org or Juan Alvarado | jalvarado@aga.org
To be added to the distribution list for this report, please notify Lucy Castaneda-Land | lcastaneda-land@aga.org
NOTICE
In issuing and making this publication available, AGA is not undertaking to render professional or other services for or on behalf of any person or entity. Nor is AGA undertaking to perform any duty owed by any person or entity to someone else. Anyone using this document should rely on his or her own independent judgment or, as appropriate, seek the advice of a competent professional in determining the exercise of reasonable care in any given circumstances. The statements in this publication are for general information and represent an unaudited compilation of statistical information that could contain coding or processing errors. AGA makes no warranties, express or implied, nor representations about the accuracy of the information in the publication or its appropriateness for any given purpose or situation. This publication shall not be construed as including, advice, guidance, or recommendations to take, or not to take, any actions or decisions regarding any matter, including without limitation relating to investments or the purchase or sale of any securities, shares or other assets of any kind. Should you take any such action or decision; you do so at your own risk. Information on the topics covered by this publication may be available from other sources, which the user may wish to consult for additional views or information not covered by this publication.
Copyright © 2024 American Gas Association. All rights reserved.