Natural Gas Market Indicators – June 25, 2026
Natural Gas Market Summary
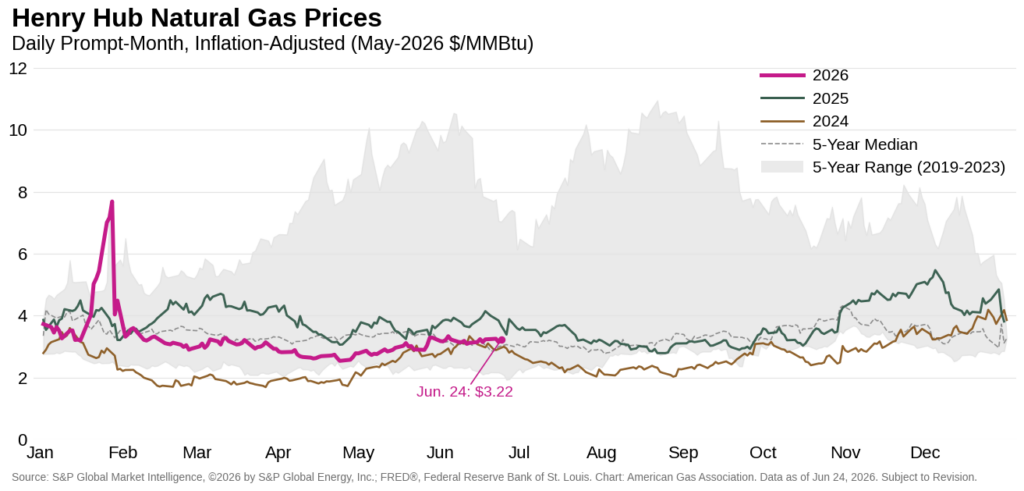
Summer is officially underway, and natural gas demand is rising as warming seasonal temperatures lift power-sector consumption. Along with strong LNG feedgas deliveries, total demand, including exports, is running above year-ago levels, underscoring the combined pull of domestic cooling needs and export demand early in the summer season. Even with stronger demand, Henry Hub futures prices have remained relatively stable, averaging $3.19 per MMBtu for the month through June 24, supported by robust dry gas production and healthy storage levels.
On a global scale, natural gas markets may begin to normalize as geopolitical risks ease following a June 15 memorandum of understanding (MOU) between the U.S. and Iran. According to Rystad Energy, the agreement reduces the likelihood of near-term disruptions to global energy flows through the Strait of Hormuz and lowers the probability of an immediate energy supply shock, though geopolitical uncertainty remains.
July Henry Hub Contract Price Muted as Summer Begins
Despite expectations for higher summer cooling demand and reaching a four-month high on June 4, Henry Hub prompt-month futures prices have edged lower since the rollover to the July contract on May 28. The July contract settled at $3.22 per MMBtu on June 24, down nearly 2 percent from its initial prompt-month settlement. The prompt month remains below the broader forward curve, settling $0.20 per MMBtu below the average 12-month strip on June 24, suggesting that market participants continue to price stronger demand over the next year, particularly during the winter months.
Cooler Week Amid a Warmer Outlook
After four consecutive weeks of warmer trends, U.S. temperatures turned cooler in mid-June. For the week ending June 20, temperatures in the U.S. were 18 percent cooler than last year and 2 percent cooler than the 30-year normal, according to cooling degree days weighted by electric home air conditioning customers. Regional conditions were mixed, with only the Middle Atlantic and Pacific experiencing warmer conditions than last year, and New England experiencing no change for the week. Compared to the 30-year normal, all regions except the East North Central, West North Central, and East South Central reported cooler temperatures.
Cooler-than-normal temperatures are expected to be short-lived. The National Oceanic and Atmospheric Administration’s (NOAA) 8–14-day outlook through the first week of July predicts above-normal temperatures across much of the lower 48 and Hawaii, with probabilities extending above 60 percent in portions of the Midwest and southern Florida. Temperatures for much of the Pacific region and Alaska are expected to be below or near normal.
Tropical Storm Arthur, the first named storm of 2026, made landfall in Texas on June 17, bringing heavy rain and flooding to the Gulf Coast. As of June 25, NOAA’s National Hurricane Center is monitoring one disturbance in the Pacific with a greater than 60 percent chance of development over the next seven days.
Cooling Demand Supports June Consumption
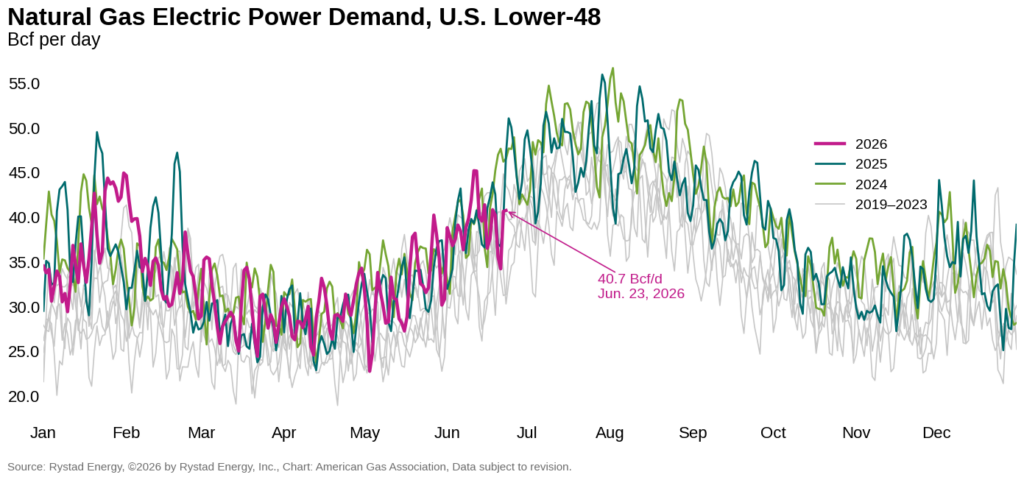
Natural gas consumption in the electric power sector continues to support stronger U.S. demand as summer officially begins. Month-to-date through June 25, total demand, including exports, increased 3 percent over the same period in May and rose 2.8 percent over the same period last year, according to preliminary data from S&P Global Energy. Domestic demand increased 3.3 percent month-over-month, driven primarily by electric power consumption, which rose 27.1 percent as warmer temperatures lifted cooling demand. Despite overall higher domestic consumption, residential and commercial demand declined 39.4 percent month-over-month, reflecting the seasonal drop-off in space-heating needs, and lags month-to-date levels last year by more than 13 percent. Industrial demand fell 3.3 percent month-over-month, consistent with typical seasonal patterns. The U.S. Energy Information Administration (EIA) notes that industrial natural gas consumption generally reaches seasonal lows during the summer months, with June forecast to be the lowest month in 2026 in the most recent Short-Term Energy Outlook.
Natural Gas Production Remains Near Record Levels
Lower 48 dry gas production growth has remained steady in recent weeks despite softer recent pricing, with year-to-date output nearly 4 percent higher than year-ago levels through June 25, according to preliminary data from S&P Global Energy.
Recent production data continue to reflect the elevated output levels observed through the first half of 2026. Preliminary data indicate that monthly production levels have consistently exceeded those recorded during the same periods last year, extending a pattern of strong output following record production in 2025. In a recent report, the U.S. Energy Information Administration (EIA) noted that natural gas production growth in the Permian Basin has outpaced crude oil production growth in recent years, with marketed natural gas production increasing 60 percent between 2021 and 2025 compared with 39 percent growth in oil production. Rising gas-oil ratios have increased associated gas production in the Permian Basin, further supporting U.S. natural gas production growth.
U.S. Feedgas Strength Supports LNG Markets as Geopolitical Risks Shift
U.S. LNG feedgas flows remain strong in the first half of 2026, far exceeding historical highs. According to preliminary data from Rystad Energy, feedgas demand averaged 18.1 Bcf per day for the year-to-date through June 24, 19 percent higher than the same period in 2025. For the month to date, deliveries are 2.5 percent higher than the same period in May and 23.6 percent higher than year-ago levels.
International LNG markets continue to watch developments in the Middle East. On June 15, the U.S. and Iran signed a memorandum of understanding (MOU), marking an important step toward conflict de-escalation, according to Rystad Energy. While not a full resolution, the agreement reduces the immediate risk of military action and establishes a 60-day negotiation window. For energy markets, the MOU shifts the near-term outlook from acute disruption risk to managed geopolitical risk. However, Rystad Energy reports that the ceasefire remains fragile; the normalization of flows through the Strait of Hormuz will take time as the agreement is tested over the coming weeks.
According to Reuters, the framework agreement could support a gradual restoration of LNG operations in the Middle East. Reuters reported that QatarEnergy is prepared to resume LNG production at its Ras Laffan plant and could bring facilities unaffected by Iranian strikes back to full output within a month. However, damaged LNG facilities are expected to take significantly longer to repair. In the near term, shipping and logistics, rather than production capacity alone, are likely to remain the primary constraint on exports, as tanker operators await safety assurances before normal transit through the Strait resume.
In other LNG news, Exxon Mobil reached an initial supply agreement with Zululand Energy Terminal, a proposed LNG import project at Richards Bay that would give South Africa its first LNG import facility. The project is tied to South Africa’s broader effort to reduce reliance on coal generation and develop a domestic gas market. Eskom, the country’s state-owned power utility, is also planning a 3,000-megawatt gas-to-power project. For Exxon Mobil, the deal expands its position in a priority growth market as the company works toward supplying more than 40 million metric tons of LNG per year by 2030.
Inventories Climb as Regional Refills Continue
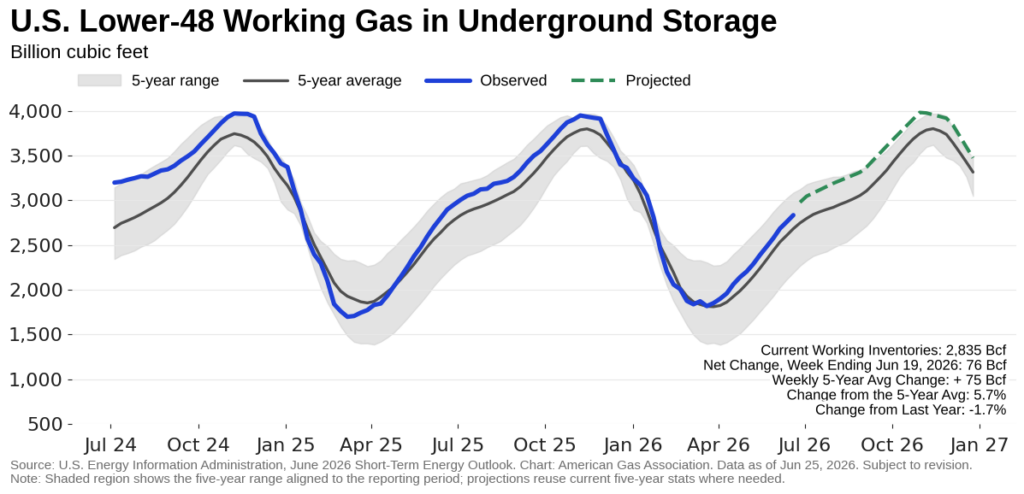
Lower 48 working gas inventories remain comfortably above the five-year average following a 76 Bcf net injection for the week ending June 19. According to the EIA, net injections in the East and Midwest accounted for nearly 80 percent of the build as both regions continue to refill following winter drawdowns. Total lower 48 inventories for the week now reached 2.8 Tcf, 5.7 percent higher than the five-year average but 1.7 percent below year-ago levels. Every region ended the week above its five-year average, while all regions except the East and South Central held year-over-year surpluses.
Cross-Border Flows Shift Amid Trade Talks
Cross-border pipeline trade showed mixed trends for the week ending June 24, according to preliminary data from Rystad Energy. Imports from Canada averaged 4.3 Bcf per day, down 1.6 percent week-over-week, while exports to Mexico averaged 6.3 Bcf per day, up 3.2 percent. For the year to date, imports from Canada are 14.3 percent lower, while exports to Mexico are up 1.1 percent.
In recent trade developments, negotiators from the U.S. and Mexico met on June 16 to discuss potential changes to the United States-Mexico-Canada Agreement (USMCA), according to Reuters. The discussion focused in part on energy-sector issues, including market access and the treatment of private and foreign investment in Mexico’s oil and natural gas sector. While the conversations do not appear to target natural gas pipeline trade directly, changes to the broader trade framework could affect the investment environment for U.S.-backed energy projects in Mexico, including cross-border infrastructure.
Pipeline Expansion Projects Gain Momentum
Mountain Valley Pipeline’s Southgate expansion took another step forward after federal regulators cleared the project to begin construction in North Carolina on June 24, according to the Pipeline and Gas Journal. The authorization follows the Federal Energy Regulatory Commission’s review of the company’s pre-construction filings and confirms that required federal approvals are in place. The Southgate project is designed to extend natural gas transportation capacity into North Carolina, where new infrastructure could help support regional reliability and growing demand.
Earlier in June, Summit Midstream Corporation (SMC) announced new commercial support for its Double E Pipeline in the Permian Basin, adding long-term shipper commitments and extending the open season through June 30. SMC reported that the commitments secured during the open season now total 250 MMcf per day, while contracted firm capacity on Double E has risen to approximately 1.9 Bcf per day. The company is evaluating a compression expansion that would raise Double E’s capacity from about 1.6 Bcf per day to 2.4 Bcf per day, with a final investment decision expected by the end of summer 2026.
Natural Gas Rigs Drive Weekly Gain, but Year-over-Year Gaps Narrow
According to Baker Hughes, the number of U.S. drilling rigs increased by one for the week ending June 18, bringing the total to 563. The current count is nine rigs above the same week last year, a 1.6 percent increase. Natural gas-directed rigs accounted for the weekly gain, rising by one to 122, while oil-directed and miscellaneous rigs were unchanged at 433 and eight, respectively. Compared with year-ago levels, natural gas-directed rigs are up nearly 10 percent, while oil rigs are 1.1 percent lower. However, those year-over-year gaps have narrowed substantially over the last several months. For the week ending January 30, natural gas-directed rigs were 27.6 percent above year-ago levels, while oil-directed rigs were more than 14 percent lower.
What to Watch:
- LNG: Given the U.S.–Iran MOU, how quickly could Middle Eastern natural gas exports return to pre-conflict levels if a deal is reached within the 60-day negotiation window?
- Prices: Will rising summer cooling demand and geopolitical risk in the Middle East push Henry Hub prompt-month futures higher, or will strong production and above-average inventories continue to cap price gains?
- Exports: How might ongoing negotiations between the U.S., Mexico, and Canada impact cross border pipeline flows in the near-term?
For questions please contact Juan Alvarado | jalvarado@aga.org, Liz Pardue | lpardue@aga.org, or Lauren Scott | lscott@aga.org
To be added to the distribution list for this report, please notify Lucy Castaneda-Land | lcastaneda-land@aga.org
Notice
In issuing and making this publication available, AGA is not undertaking to render professional or other services for or on behalf of any person or entity. Nor is AGA undertaking to perform any duty owed by any person or entity to someone else. Anyone using this document should rely on his or her own independent judgment or, as appropriate, seek the advice of a competent professional in determining the exercise of reasonable care in any given circumstances. The statements in this publication are for general information and represent an unaudited compilation of statistical information that could contain coding or processing errors. AGA makes no warranties, express or implied, nor representations about the accuracy of the information in the publication or its appropriateness for any given purpose or situation. This publication shall not be construed as including advice, guidance, or recommendations to take, or not to take, any actions or decisions regarding any matter, including, without limitation, relating to investments or the purchase or sale of any securities, shares or other assets of any kind. Should you take any such action or decision; you do so at your own risk. Information on the topics covered by this publication may be available from other sources, which the user may wish to consult for additional views or information not covered by this publication
Data Disclaimer Notice: S&P Global Energy
Reproduction of any information, data or material, including ratings (“Content”) in any form is prohibited except with the prior written permission of the relevant party. Such party, its affiliates and suppliers (“Content Providers”) do not guarantee the accuracy, adequacy, completeness, timeliness, or availability of any Content and are not responsible for any errors or omissions (negligent or otherwise), regardless of cause, or for the result obtained from the use of such Content. In no event shall Content Providers bed liable for any damages, costs, expenses, legal fees, or losses (including lost income or lost profit and opportunity costs) in connection with any use of the Content. A reference to a particular investment or security, a rating or any observation concerning an investment that is part of the Content is not a recommendation to buy, sell or hold such investment or security, does not address the suitability of an investment or security and should not be relied on as investment advice. Credit ratings are statements of opinions and are not statement of fact.
Copyright © 2026 American Gas Association. All rights reserved.