Natural Gas Market Indicators – July 9, 2026
Natural Gas Market Summary
The second month of summer is here, and natural gas demand is rising as temperatures continue to climb. July brought the first heatwave of the summer, spreading across the central and eastern U.S. over the Fourth of July weekend and pushing electric power demand higher. According to data from Rystad Energy, natural gas demand for electric power generation averaged 45.6 Bcf per day for the week ending July 7, more than 15 percent, higher than the previous week. Even with stronger cooling-driven demand, Henry Hub futures prices remained relatively steady, trading within a range of $3.15 to $3.34 per MMBtu since mid-June amid strong supply fundamentals.
In its July Short-Term Energy Outlook (STEO), the Energy Information Administration (EIA) projects that natural gas consumption in the electric power sector will continue to rise in 2026 and 2027, with a new annual record expected next year. The EIA forecasts that electric power consumption will rise 2 percent year-over-year in 2026 and 4 percent in 2027, reaching a record 38.1 Bcf per day. Henry Hub spot prices are expected to remain relatively stable over that period, supported by record natural gas production and above-average underground storage inventories. Henry Hub spot prices are projected to average $3.57 per MMBtu in the fourth quarter of 2026, 5 percent below the same period in 2025. In 2027, annual prices are expected to average $3.49 per MMBtu.
Futures Price Gains in July Contract
Henry Hub futures prices have moved higher as the market enters the peak summer demand period. The July prompt-month contract averaged $3.21 per MMBtu, 11.4 percent higher than the average June prompt-month price, before expiring at $3.23 per MMBtu on June 26. Early prompt-month pricing for the August contract has largely held near this level, trading between $3.18 and $3.28 per MMBtu through July 8.
The 12-month futures strip has softened in recent weeks, falling more than 2 percent since the July contract expired. At the same time, the spread between the strip and prompt-month settlement has narrowed, from an average of $0.52 per MMBtu during the June prompt-month contract to $0.22 per MMBtu in July and just $0.12 per MMBtu so far in August. The narrowing spread suggests that summer demand expectations are being reflected more directly in prompt-month pricing, bringing near-term prices closer to the broader 12-month average.
Heat Domes Bring Higher Temps
Temperatures are heating up this summer. A persistent heat dome settled across much of the central and eastern U.S. over the Fourth of July weekend, and another dome is expected for the weekend of July 10. For the week ending July 4, U.S. weather was 15.0 percent warmer than the same week last year and 39.4 percent warmer than the 30-year normal, based on electric-customer weighted cooling degree days. All regions except the Mountain and Pacific regions were warmer than normal and the same week last year. Regional deviations from normal temperatures ranged from 166.7 percent warmer in New England to 48.6 percent cooler in the Pacific. Similarly, deviations from the same week last year ranged from 60.0 percent warmer in New England to 59.1 percent cooler in the Pacific.
Looking into mid-July, the National Oceanic and Atmospheric Administration (NOAA) expects warmer-than-normal temperatures to continue. NOAA’s 8–14-day outlook indicates above-normal temperatures are likely across most of the U.S. through July 22. The highest probabilities are expected in southern Florida and the northern tier, particularly in the Mountain region. Near-normal temperatures are forecast for the Northeast and a portion of the Southwest. Alaska’s temperature outlook is mixed, with the forecast ranging from below- to near-normal during this time.
At the time of this writing, NOAA’s National Hurricane Center is monitoring three disturbances in the Pacific, two with a 40–60 percent chance of cyclone formation in the next seven days and one with a less than 40 percent chance.
Demand Higher on LNG Feedgas Deliveries, Electric Power Consumption
Natural gas demand continues to climb, driven by LNG feedgas deliveries and electric power consumption. In June alone, natural gas demand in the power sector rose to 43 Bcf per day, the highest level on record for the month, according to preliminary data from Rystad Energy. Power sector demand was 28.6 percent higher than May and 6.5 percent above the same period last year.
For the first half of 2026, total natural gas demand, including exports, averaged 119 Bcf per day, rising 2.2 percent compared to the same period last year. By comparison, domestic consumption is 1 percent lower, driven by residential and commercial demand trailing the first half of 2025 by 8.3 percent and 6.8 percent, respectively. Electric power demand is up 1.4 Bcf per day, or 4.2 percent, over this period.
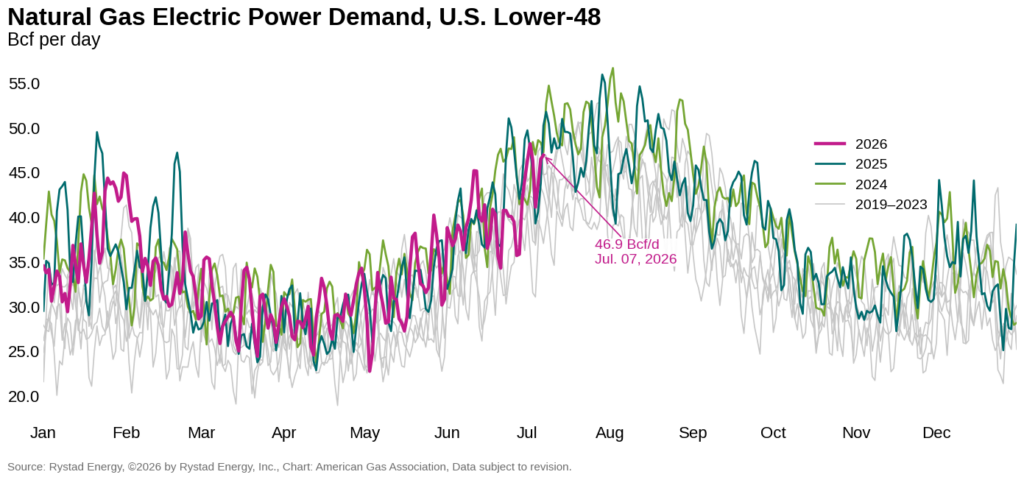
Into July, Rystad Energy’s current demand forecast suggests that electric power consumption will increase to around 49 Bcf per day, 13.2 percent higher than in June but 1.2 percent lower than the all-time record of 49.3 Bcf per day set in July 2024. Higher power sector demand is expected to support at 6.6 percent gain in domestic consumption in July compared to June 2026 levels.
Production Gains in H1 2026
U.S. dry gas production averaged 111.2 Bcf per day in June, rising 3.4 percent over the same month last year but declining 0.2 percent compared to last month, according to preliminary data from Rystad Energy. Year-to-date through June, production has averaged 110.7 Bcf per day and remains on track to break the 2025 annual record of nearly 108.0 Bcf per day.
For 2026, Rystad Energy forecasts dry gas production to average 111.6 Bcf per day, or 3.6 percent higher than 2025 levels. Similarly, the EIA’s STEO projects production to average 111.2 Bcf per day in 2026, with growth led by the Permian region.
New Annual LNG Feedgas Record Expected in 2026
According to preliminary data from Rystad Energy, LNG feedgas deliveries averaged 17.5 Bcf per day in June, nearly 3 percent higher than the previous month and 22.3 percent above June 2025 levels. For the year to date through July 7, LNG feedgas demand averaged 18.1 Bcf per day, rising nearly 19 percent over the same week last year. Rystad Energy forecasts indicate LNG feedgas volumes could reach 18.7 Bcf per day in 2026 and 21.1 Bcf per day in 2027.
In the global LNG market, Rystad Energy reports that LNG prices at key European and Asian trading hubs have fallen following the news of a signed memorandum of understanding between the U.S. and Iran on June 17. Northwest European LNG prices fell 5.6 percent to $13.5 per MMBtu on June 24 compared to the week prior while prompt month prices in Asia fell 2.9 percent week-over-week on June 23. Geopolitical uncertainty remains the key driver of pricing at global hubs, even despite physical fundamentals, particularly in Europe where last week’s heat wave appeared to be backseat to lowered tensions in the Middle East when it came to LNG pricing.
Looking ahead, Shell’s 2026 LNG Outlook underscores the continued importance of LNG in global energy markets, with long-term demand expected to approach 700 million tons per annum (MTPA) by 2050. The report highlights the growing role of U.S. LNG in meeting demand, noting that U.S. LNG exports rose to around 109 MTPA in 2025 from about 4 MTPA in 2016. The report also points to continued market sensitivity around geopolitical and shipping risks, with Europe increasingly relying on U.S. LNG to support storage refill needs amid lower-than-usual inventories in late May.
The International Energy Agency’s (IEA) Q3 2026 Gas Market Report similarly points to near-term LNG market tightness. The report notes that Strait of Hormuz LNG flows have accounted for almost 20 percent of global LNG supply. However, new LNG supply from North America and Africa, along with improved feedgas availability from legacy producers, helped offset about three-quarters of the decline in Gulf LNG deliveries from March through June.
Storage
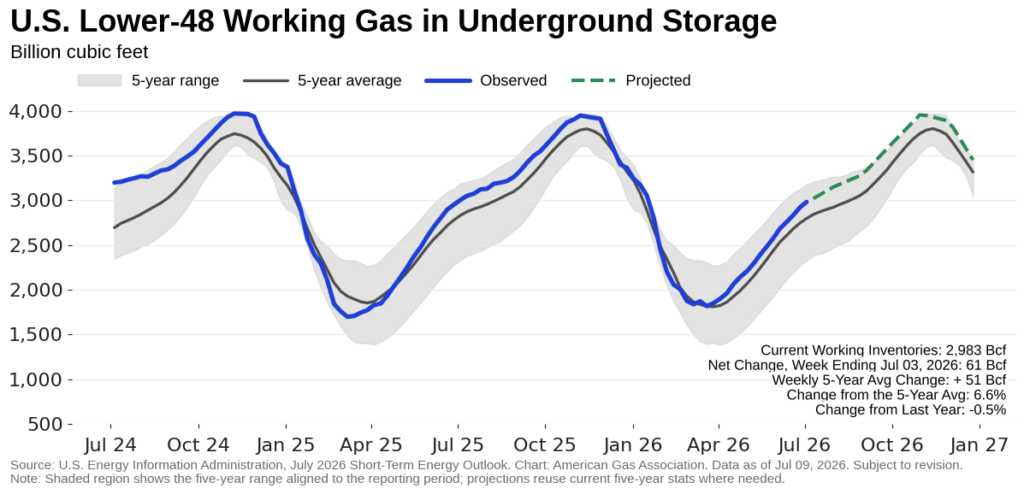
The EIA reported a 61 Bcf net injection into underground storage for the week ending July 3, bringing lower 48 working natural gas inventories to 2,983 Bcf. Inventories are now 6.6 percent above the five-year average but 0.5 percent below year-ago levels. Underground storage stocks remain above the regional five-year averages across all regions, while only the East and South Central regions are currently below last year’s levels.
Cross-Border Flows Mixed at Mid-Year
Cross-border pipeline flows eased for the week ending July 6, according to preliminary data from Rystad Energy. Exports to Mexico averaged 6.3 Bcf per day, down 1.1 percent from the previous week, while imports from Canada averaged 4.0 Bcf per day, down 6.3 percent. In contrast, year-over-year trends were mixed, with Canadian imports down 23.1 percent while exports to Mexico rose 5.4 percent.
U.S. Drilling Activity Increases Week-over-Week
U.S. drilling activity increased for the week ending July 2, with the total rig count rising by seven rigs, or 1.2 percent, from the previous week, according to data from Baker Hughes. The weekly gain was primarily driven by oil-directed drilling, which increased by five rigs, while gas and miscellaneous rigs each added one. Compared with the same period las year, the total rig count is up by 41 rigs, or 7.6 percent. Gas-directed rigs remain materially higher year-over-year, up approximately 17 percent, while oil-directed rigs are about 5 percent higher.
Analysis from Rystad Energy suggests that private rig operators have increased horizontal activity over the past two months in response to elevated oil commodity prices amid ongoing tension in the Middle East.
What to Watch:
- Prices: How much cooling demand is already priced into near-term futures, particularly as a second heat dome forms?
- Demand: How high could power sector demand climb before summer temperatures peak?
- Storage: Will injections remain strong enough to keep inventories comfortably above average through peak cooling season?
For questions please contact Juan Alvarado | jalvarado@aga.org, Liz Pardue | lpardue@aga.org, or Lauren Scott | lscott@aga.org
To be added to the distribution list for this report, please notify Lucy Castaneda-Land | lcastaneda-land@aga.org
Notice
In issuing and making this publication available, AGA is not undertaking to render professional or other services for or on behalf of any person or entity. Nor is AGA undertaking to perform any duty owed by any person or entity to someone else. Anyone using this document should rely on his or her own independent judgment or, as appropriate, seek the advice of a competent professional in determining the exercise of reasonable care in any given circumstances. The statements in this publication are for general information and represent an unaudited compilation of statistical information that could contain coding or processing errors. AGA makes no warranties, express or implied, nor representations about the accuracy of the information in the publication or its appropriateness for any given purpose or situation. This publication shall not be construed as including advice, guidance, or recommendations to take, or not to take, any actions or decisions regarding any matter, including, without limitation, relating to investments or the purchase or sale of any securities, shares or other assets of any kind. Should you take any such action or decision; you do so at your own risk. Information on the topics covered by this publication may be available from other sources, which the user may wish to consult for additional views or information not covered by this publication
Data Disclaimer Notice: S&P Global Energy
Reproduction of any information, data or material, including ratings (“Content”) in any form is prohibited except with the prior written permission of the relevant party. Such party, its affiliates and suppliers (“Content Providers”) do not guarantee the accuracy, adequacy, completeness, timeliness, or availability of any Content and are not responsible for any errors or omissions (negligent or otherwise), regardless of cause, or for the result obtained from the use of such Content. In no event shall Content Providers bed liable for any damages, costs, expenses, legal fees, or losses (including lost income or lost profit and opportunity costs) in connection with any use of the Content. A reference to a particular investment or security, a rating or any observation concerning an investment that is part of the Content is not a recommendation to buy, sell or hold such investment or security, does not address the suitability of an investment or security and should not be relied on as investment advice. Credit ratings are statements of opinions and are not statement of fact.
Copyright © 2026 American Gas Association. All rights reserved.