Natural Gas Market Indicators – May 28, 2026
Natural Gas Market Summary
The U.S. natural gas market remains well supplied heading into summer, keeping price growth modest despite signs of strengthening demand. After several weeks below $3 per MMBtu, the June Henry Hub contract expired slightly above that mark on May 27. Meanwhile, demand is rising ahead of summer, supported by exports, industrial consumption, and power sector utilization. Dry gas production is also edging higher following subdued shoulder season output. Combined with healthy underground storage inventories, this leaves the market well positioned to meet rising weather-sensitive demand in the weeks ahead.
The U.S. accounted for nearly one-quarter of global energy demand growth in 2025, according to the International Energy Agency’s 2026 Global Energy Review released on April 20. Growth was driven by a harsh winter, strong electricity demand from data centers, and robust economic activity. U.S. energy demand increased by more than 2 percent, marking the second-fastest annual increase since 2000, excluding post-recession rebound years. Global natural gas demand increased by 1 percent from 2024 levels, with incremental demand largely concentrated in the U.S., European Union, and Middle East. In the U.S., winter weather contributed to a 1 percent year-over-year increase in natural gas consumption.
Natural Gas Futures Muted as June Contract Expires
Henry Hub futures remain subdued as sustained production and healthy storage inventories weigh on prices. After several weeks below $3, the Henry Hub prompt month rose to $3.11 per MMBtu on May 19, the highest price since mid-March. At expiration on May 27, the June contract closed at $3.04 per MMBtu, 9.4 percent higher than the first trading day of the month. The July prompt-month contract opened five cents higher on Thursday. Meanwhile, the spread between the 12-month strip and the prompt-month price has contracted from $0.71 per MMBtu on April 29 to $0.28 per MMBtu on May 27.
Temperatures May Heat Up This Summer
So far in May, temperatures across the U.S. have remained relatively mild. Month-to-date through May 24, population-weighted cooling degree days totaled 69, 5.5 percent lower (or cooler) than the 30-year normal and 2.8 percent below the same period in 2025, according to data from the National Oceanic and Atmospheric Administration (NOAA).
Recent data, however, suggest that temperatures may be warming to above-normal conditions as summer approaches. For the week ending May 23, weather in the U.S. was 31 percent warmer than in 2025 and 52 percent warmer than normal. All regions were cooler than normal except the West North Central, Mountain, and Pacific regions.
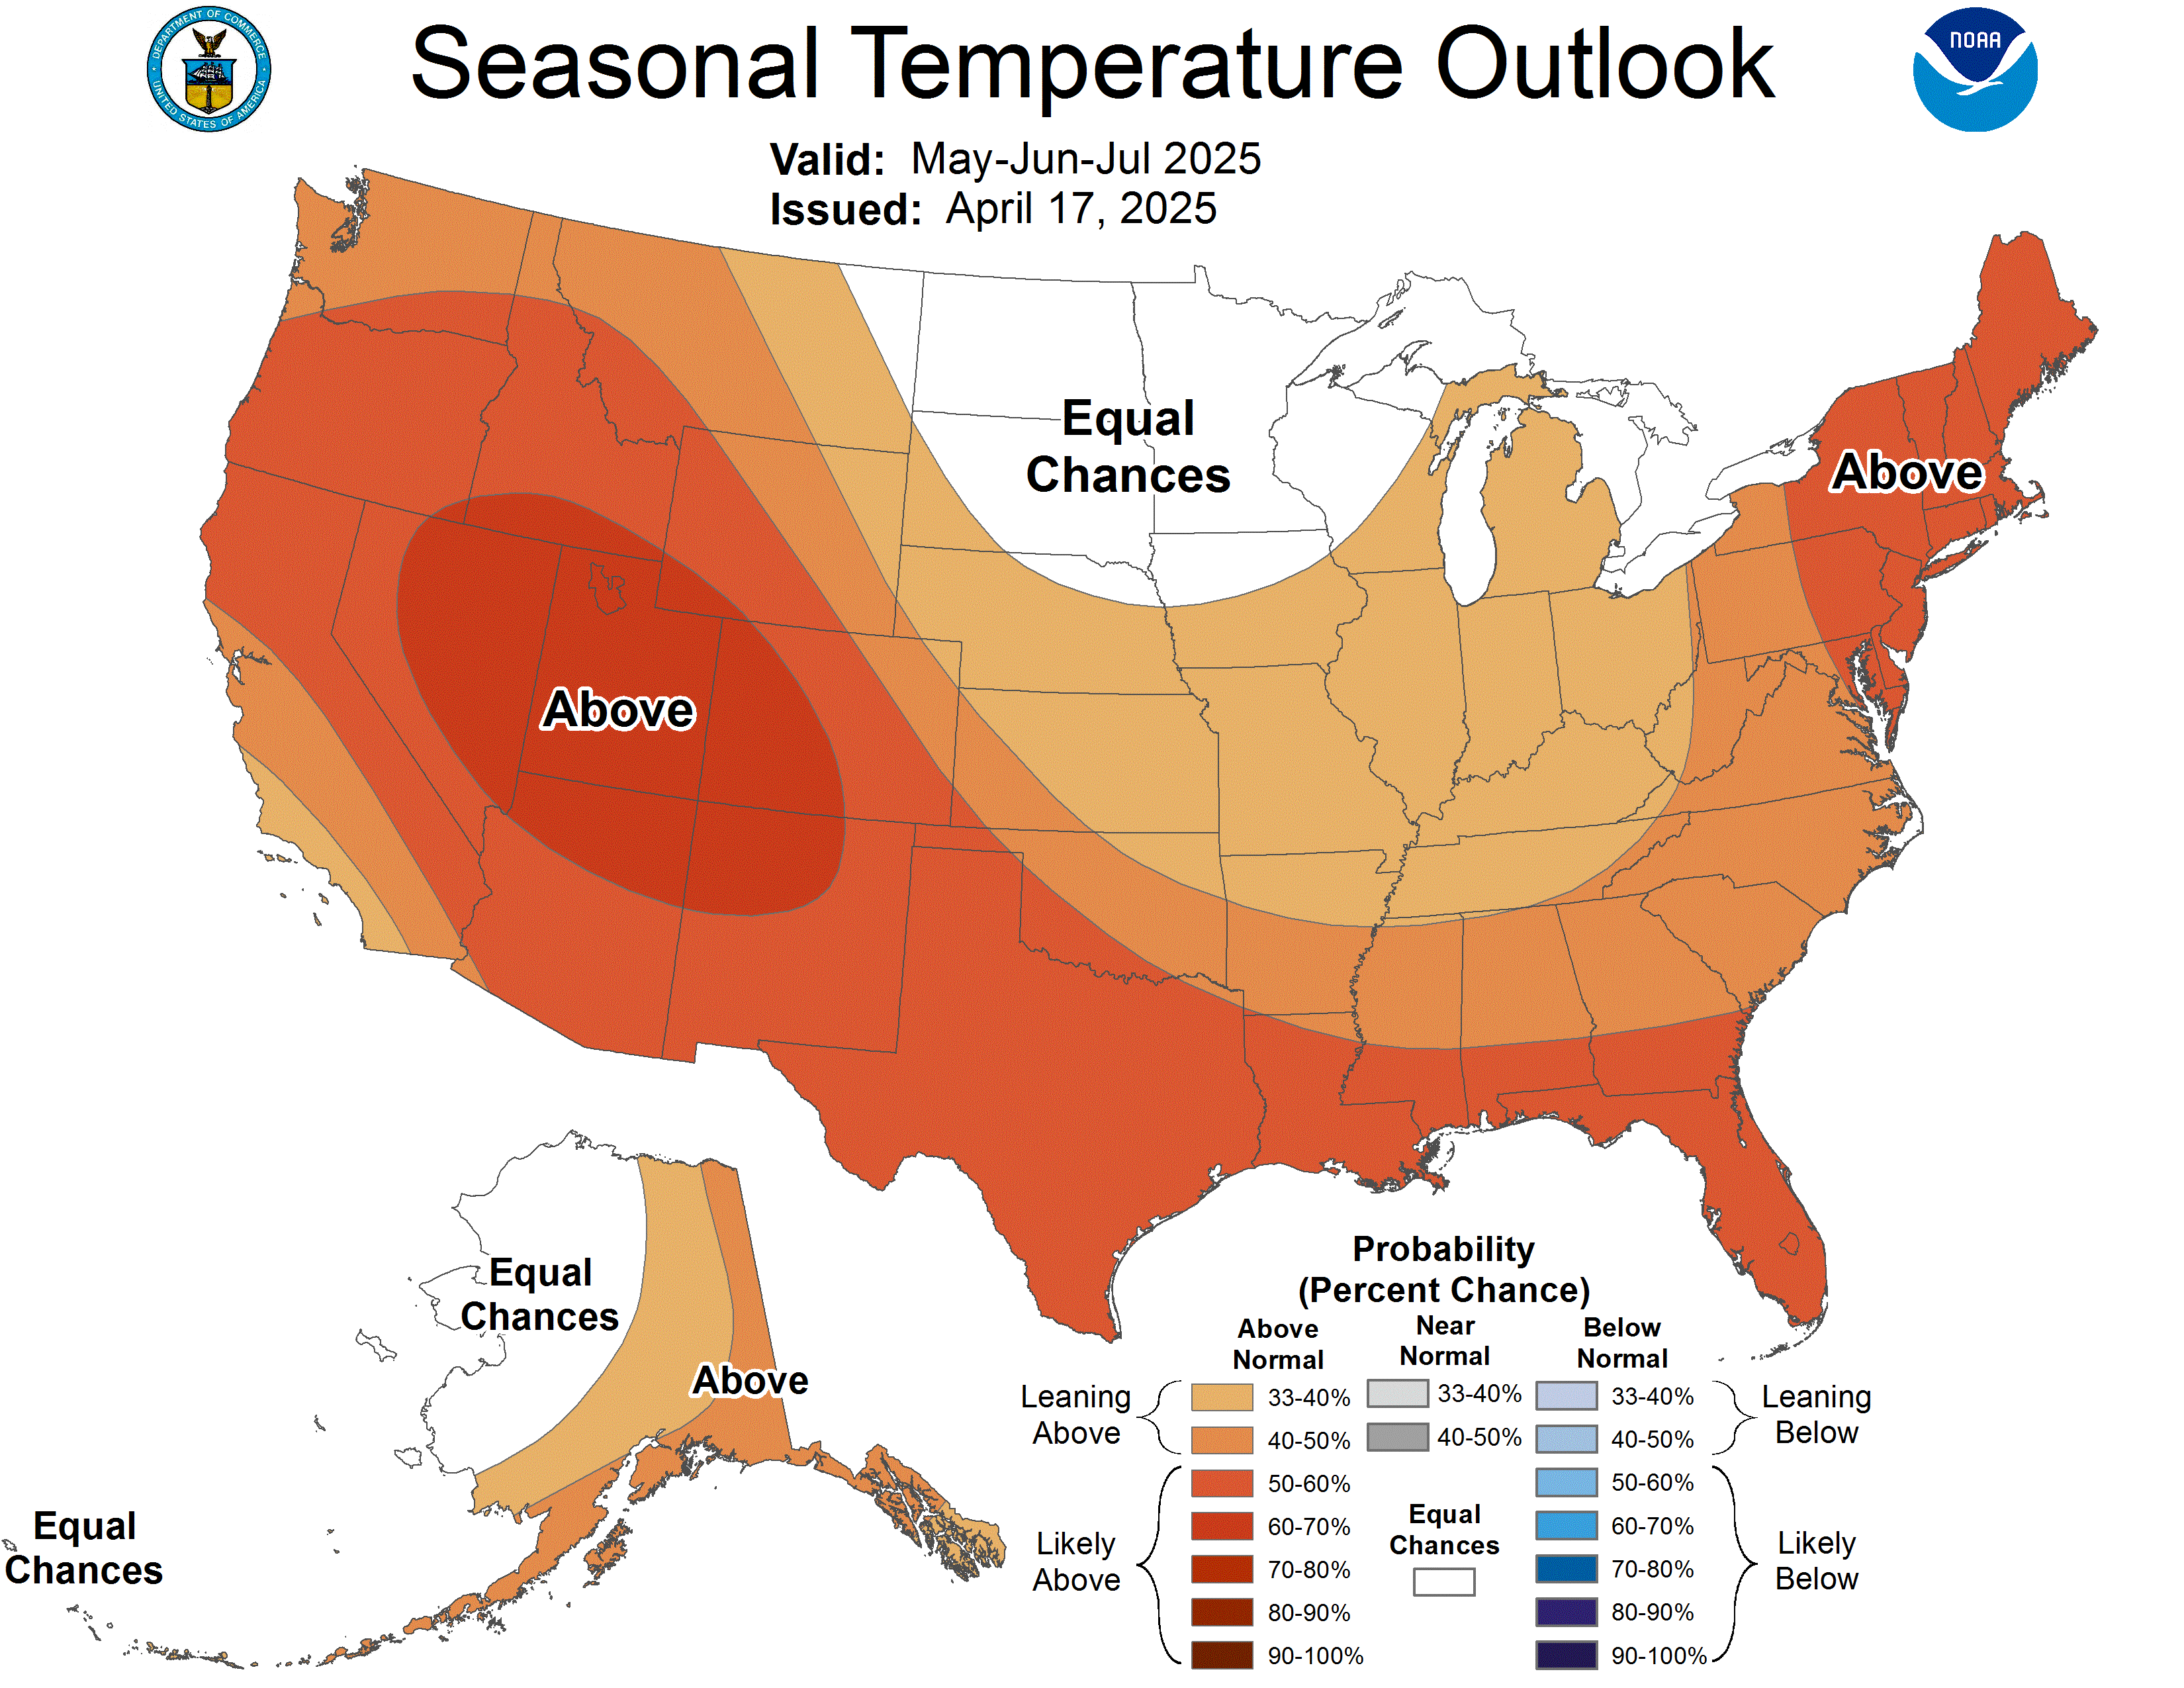
Temperatures will be a key driver of natural gas demand during the summer months, particularly as cooling loads increase. NOAA’s latest Seasonal Temperature Outlook, released on May 21, suggests that warmer-than-normal conditions are probable across much of the continental U.S. for June, July, and August, with no regions currently leaning toward below-normal temperatures. The highest probability of above-normal temperatures is concentrated in the Pacific Northwest and northern Rockies, while equal chances are forecast across the north-central U.S. and parts of Alaska.
Total Demand Strengthens Year-to-Date
Year-to-date through May 28, total U.S. natural gas demand, including exports, is 1.6 percent higher than in 2025, while domestic demand is down 2.1 percent, according to preliminary data from S&P Global Energy. Export-related demand, including LNG feedgas and pipeline exports, and electric power demand are higher year-to-date, while residential and commercial demand and industrial demand are 9.0 percent and 0.8 percent lower, respectively, than during the same period in 2025.
On a month-to-date basis, warmer-than-normal temperatures in May have helped push electric power demand 2.7 percent higher than during the same period in 2025. Industrial demand also increased over this period, rising 1.9 percent, while residential and commercial demand declined by 2.7 percent. Overall, domestic demand is up 1.4 percent month-to-date.
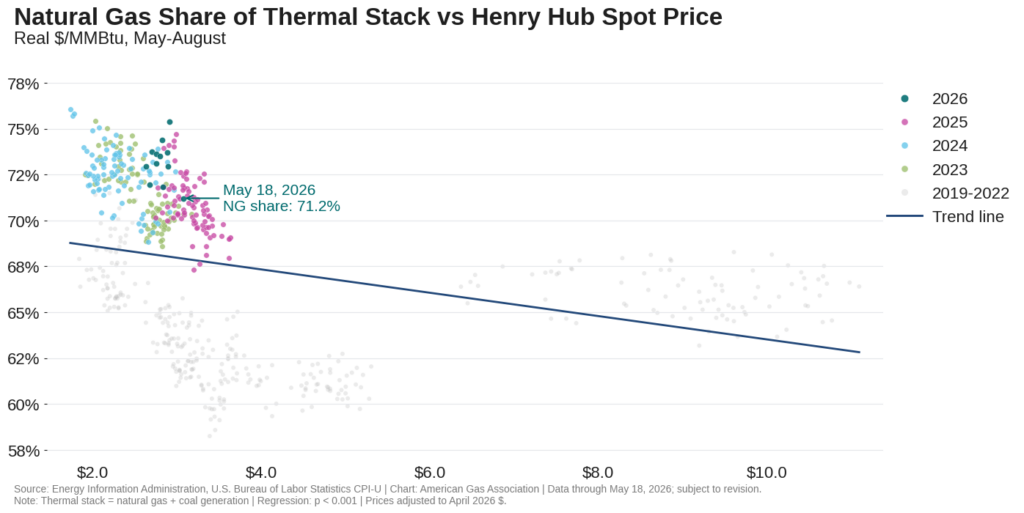
Looking ahead to the summer months, electric power demand volumes will be shaped by temperatures and relative commodity prices. Historically, lower inflation-adjusted (i.e., real) Henry Hub spot prices have generally corresponded with a higher share of natural gas within the thermal stack between May and August.
Production Moves Modestly Higher as Summer Nears
After holding steady during the spring, dry natural gas production may be turning upward. For the month to date through May 28, lower-48 dry gas production is up 0.3 percent relative to April and 3 percent higher than year-ago levels, according to preliminary data from S&P Global Energy. For the year to date, production is 3.6 percent higher than the same period in 2025.
Global LNG Market Remains Uncertain
Cargo shipments through the Strait of Hormuz have partially normalized, according to Rystad Energy, with vessel-tracking data indicating that crude oil flows through the Strait averaged over 3 million barrels per day for the week ending May 25. However, the reported peace agreement remains unofficial, and conflicting accounts of the deal continue to cloud the outlook about the durability of the recovery.
Even if shipment flows recover to pre-event levels, the global gas market may face lingering effects from the three-month disruption. Europe is entering the summer refill season from a weaker storage position, with inventories 14 percent below the five-year average as of May 23, while LNG shipments remain constrained. Reuters reports that QatarEnergy canceled five cargoes to one of its largest European customers on May 25, extending its force majeure notice from early July to mid-August, signaling that contractual delivery obligations may remain affected for longer than initially expected due to damage at the Ras Laffan facility. According to Reuters, Europe may risk a major gas shortage if disruptions with shipments continue into the summer months.
At the same time, the potential for a hotter-than-normal summer in Asia could increase cooling demand, further tightening an already competitive LNG market. If Asian demand strengthens, competition with European buyers for flexible LNG cargoes could intensify, increasing the risk of higher global gas prices. In that environment, U.S. LNG is likely to remain a key supply source for both Europe and Asia.
U.S. feedgas demand in May has remained below recent highs, reflecting ongoing maintenance at Freeport and Cameron LNG facilities and early-month maintenance at Golden Pass LNG. Month-to-date through May 27, LNG feedgas deliveries to export terminals averaged 17 Bcf per day, which is 12.2 percent higher than the same period in 2025, but 10.4 percent lower than the same period last month, according to data from Rystad Energy. RBN Energy reports that flows are expected to increase by the end of this week, as maintenance wraps up and offline trains at Freeport and Cameron LNG return to service. Other facilities, including Cove Point, Elba Island, Calcasieu Pass, and Plaquemines, continue to operate at or above typical utilization levels amid elevated global demand.
Lower 48 Storage Inventories Return to Late January Levels
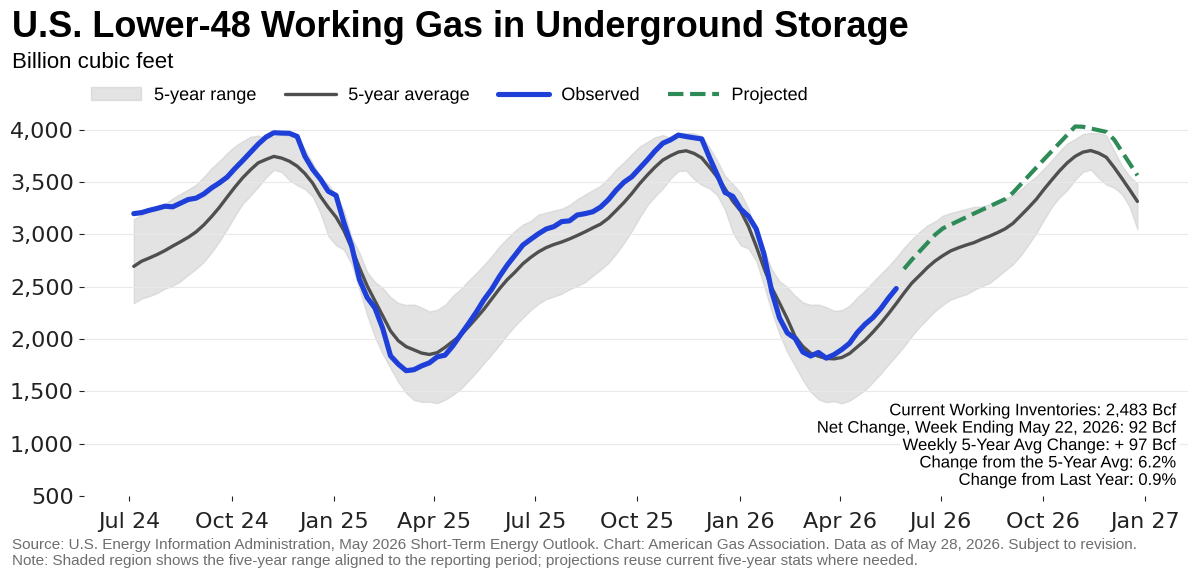
According to the Energy Information Administration (EIA), a net injection of 92 Bcf into underground storage brought lower 48 working gas stocks to 2,483 Bcf for the week ending May 22. The change was driven by a 34 Bcf net injection in the Midwest and a 28 Bcf net injection in the East. Working gas inventory now stands 6.2 percent above the five-year average and nearly 1 percent above year-ago levels. While inventories in all regions are above their respective five-year averages for the week, only three regions—the Pacific, Mountain, and Midwest—currently hold a year-over-year surplus.
U.S. Pipeline Trade Up Year-to-Date
Into late May, U.S. cross-border pipeline trade has increased in 2026 compared to the same period in 2025. According to preliminary data from Rystad Energy, imports from Canada have averaged 5.3 Bcf per day year-to-date through May 27, increasing 3.6 percent over 2025. Similarly, exports to Mexico have increased by 26.1 percent over the same period last year, averaging 7.4 Bcf per day.
Most recently, for the week ending May 27, imports from Canada averaged 3.4 Bcf per day, falling 1.5 percent week-over-week and 29.8 percent year-over-year. Exports to Mexico averaged 6.1 Bcf per day, declining 5.6 percent compared to last week and 3.5 percent relative to the same period last year.
Permitting Reform and Pipeline Expansion
The Federal Energy Regulatory Commission proposed sweeping reforms to its permitting process for natural gas facilities on May 21 in an effort to accelerate construction and promote affordable and reliable energy. The notice of proposed rulemaking would broaden the types and sizes of projects eligible for streamlined review, including certain compressor station expansions, receipt and delivery point modifications, facility abandonments based on actual abandonment costs, and storage well abandonments that do not affect a storage field’s physical parameters.
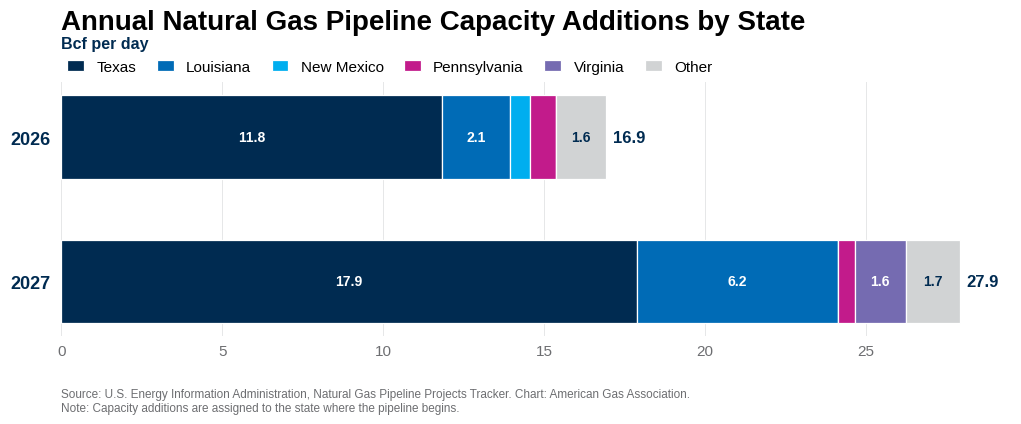
In the near term, EIA data indicate that Texas accounts for most of the planned natural gas pipeline capacity additions for 2026 and 2027. According to the EIA’s natural gas pipeline projects tracker, approximately 44.9 Bcf per day of new pipeline capacity is expected to enter service over the two-year period, with more than 66 percent originating in Texas. The Texas pipeline projects are expected to provide additional takeaway capacity from the Permian Basin, helping to ease bottlenecks around the Waha Hub while supplying LNG export terminals and other domestic users.
Natural Gas Rig Count Moves Lower
The natural gas rig count fell for the third consecutive week in May but remains above year-ago levels. For the week ending May 22, the number of gas-directed rigs fell by three to 125, a decline of 2.3 percent, according to Baker Hughes. The decline was concentrated in the Haynesville, where the rig count dropped by four. By comparison, the number of oil rigs increased by 10 to 425 week-over-week. On balance, the total U.S. rig count is up 1.3 percent for the week but lags the same period last year by 8 rigs or 1.4 percent.
Activity in the Permian Basin is the primary driver of oil-directed rig activity over the last week. Rystad Energy reports that operators are responding to a firmer oil price environment. In its first quarter of 2026 earnings call, Diamondback CEO Kaes Van’t Hof estimated the company could add up to 30 additional rigs in the Permian by year-end.
What to Watch:
- LNG: How might maintenance at U.S. LNG export facilities and reduced cargo shipments through the Strait of Hormuz impact near-term sentiment surrounding supply availability in global markets, particularly as the summer cooling season begins?
- Infrastructure: If FERC finalizes its permitting reform rulemaking, could faster natural gas infrastructure development improve regional deliverability and grid flexibility, particularly in regions where siting, permitting, and cost-recovery processes remain more complex?
- Prices: As summer approaches, will warmer-than-normal temperatures, rising electric power demand, and relative coal-to-gas switching economics move Henry Hub futures prices higher outweigh healthy supply-side fundamentals?
For questions please contact Juan Alvarado | jalvarado@aga.org, Liz Pardue | lpardue@aga.org, or Lauren Scott | lscott@aga.org
To be added to the distribution list for this report, please notify Lucy Castaneda-Land | lcastaneda-land@aga.org
Notice
In issuing and making this publication available, AGA is not undertaking to render professional or other services for or on behalf of any person or entity. Nor is AGA undertaking to perform any duty owed by any person or entity to someone else. Anyone using this document should rely on his or her own independent judgment or, as appropriate, seek the advice of a competent professional in determining the exercise of reasonable care in any given circumstances. The statements in this publication are for general information and represent an unaudited compilation of statistical information that could contain coding or processing errors. AGA makes no warranties, express or implied, nor representations about the accuracy of the information in the publication or its appropriateness for any given purpose or situation. This publication shall not be construed as including advice, guidance, or recommendations to take, or not to take, any actions or decisions regarding any matter, including, without limitation, relating to investments or the purchase or sale of any securities, shares or other assets of any kind. Should you take any such action or decision; you do so at your own risk. Information on the topics covered by this publication may be available from other sources, which the user may wish to consult for additional views or information not covered by this publication
Data Disclaimer Notice: S&P Global Energy
Reproduction of any information, data or material, including ratings (“Content”) in any form is prohibited except with the prior written permission of the relevant party. Such party, its affiliates and suppliers (“Content Providers”) do not guarantee the accuracy, adequacy, completeness, timeliness, or availability of any Content and are not responsible for any errors or omissions (negligent or otherwise), regardless of cause, or for the result obtained from the use of such Content. In no event shall Content Providers bed liable for any damages, costs, expenses, legal fees, or losses (including lost income or lost profit and opportunity costs) in connection with any use of the Content. A reference to a particular investment or security, a rating or any observation concerning an investment that is part of the Content is not a recommendation to buy, sell or hold such investment or security, does not address the suitability of an investment or security and should not be relied on as investment advice. Credit ratings are statements of opinions and are not statement of fact.
Copyright © 2026 American Gas Association. All rights reserved.