Natural Gas Market Indicators – November 12, 2026
Natural Gas Market Summary
The winter heating season is officially underway, and recent analysis suggests the natural gas supply-demand balance may be loosening. The U.S. Energy Information Administration (EIA) expects natural gas production growth to outpace increasing domestic demand and exports into 2027, according to its November 2026 Short-Term Energy Outlook (STEO). Despite softer production trends in early November, EIA raised its annual production forecast by nearly 1 percent from last month’s outlook, signaling continued domestic supply strength amid growing LNG export demand. Expectations of a looser market are weighing on natural gas price forecasts, with the EIA projecting an average spot price under $3 per MMBtu in 2027. In addition, the EIA increased its projected end-of-winter storage inventories by nearly 3 percent from October’s forecast, supported in part by fewer expected heating degree days (HDDs) in November.
LNG feedgas reached a new daily record on November 7, while cooler near-term forecasts helped lift natural gas prices in early November. However, the National Oceanic and Atmospheric Administration (NOAA) continues to favor above-normal temperatures across much of the northern and central U.S. into late November. The timing, intensity, and duration of sustained colder weather will help determine how quickly heating demand and record export flows draw down storage inventories in coming weeks.
Future Prices Shift Higher in Early November
Natural gas prices at the U.S. benchmark have edged higher in November amid expectations for a short-lived cold spell, according to the Wall Street Journal. The December Henry Hub futures contract settled at $3.22 per MMBtu on November 11, up nearly 13 percent since the first trading day of the month a week earlier. Intraday prices on November 12 held ground, with prices opening at $3.24 per MMBtu and reaching a high of $3.32 per MMBtu at the time of this writing.
Despite recent futures price gains, near-term spot price forecasts have retreated. In the November STEO, the EIA lowered its 2026 and 2027 Henry Hub spot price forecasts by 3.3 percent and nearly 9 percent, respectively, with prices expected to average under $3 per MMBtu next year. For the winter heating season (i.e., November 2026 through March 2027), spot prices are now expected to average $2.87 per MMBtu, a 16.3 percent reduction compared to the October STEO forecast. The EIA attributed the revisions to warmer temperatures in early November and higher anticipated storage inventories in coming months.
Temps Are Heating Up Ahead of Thanksgiving
Despite an anticipated near-term dip in temperatures, the winter heating season has yet to live up to its name, with warmer weather largely prevailing in recent weeks and expected to continue in the near term. For the week ending November 7, domestic temperatures were nearly 17 percent warmer than last year and more than 27 percent warmer than the 30-year normal (1970-2001), according to NOAA HDD data weighted by natural gas home heating customers. All regions were warmer than last year except the Mountain and Pacific, which were 37.2 percent and 77.5 percent colder, respectively. Compared to the 30-year normal, only the Pacific posted colder temps, with six more HDDs for the week.
Into mid-November, NOAA’s current 8–14-day forecast suggests the U.S. may experience a warmer-than-normal lead-up to Thanksgiving. Through November 25, much of the U.S. is expected to experience above normal temperatures, with the highest probabilities of more than 60 percent expected around the Great Lakes and Northeast. The Mountain, Pacific, and Southwest are the exceptions, where near- and below-normal temperatures are expected.
Meanwhile, all is quiet in the Atlantic, where no tropical cyclone activity is expected during the next seven days.
HDDs Rise Month-Over-Month, Supporting Higher ResCom Demand
U.S. natural gas demand continues to outpace year-over-year, driven by higher power sector demand and strong LNG exports. For the year to date through October, data from Rystad Energy indicates total natural gas demand, including exports, is up 2.6 percent compared to the same period in 2025, supported primarily by a more than 18 percent increase in LNG exports over the same period. Domestic consumption is up 0.6 percent, with lower residential and commercial demand nearly offsetting gains in electric power and industrial sector demand.
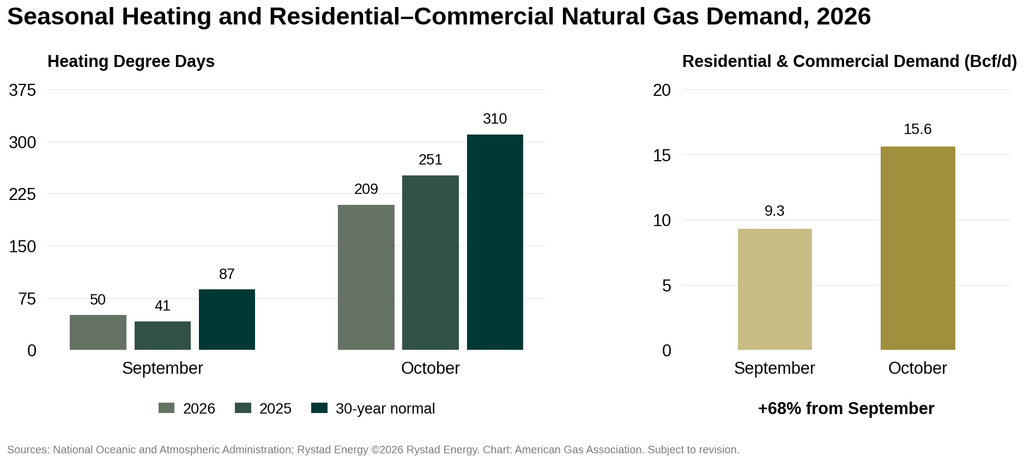
On a monthly basis, total natural gas demand in October rose 1.6 percent over September, supported by rising residential and commercial sector demand as HDDs accumulated. Compared to the prior month, October HDDs rose from 50 to 159, contributing to a nearly 68 percent rise in residential and commercial demand. Electric power demand fell by 18.2 percent month-over-month, averaging 35.1 Bcf per day in October.
U.S. Production Remains Elevated Despite Weekly Decline
U.S. dry natural gas production declined 0.7 percent for the week ending November 12 compared with the prior week but remained 2.5 percent above year-ago levels, according to preliminary S&P Global Energy data. Average year-to-date production through November 12 was 4.5 percent higher than during the same period in 2025.
Despite the recent weekly decline, production during the first 12 days of November was 1.4 percent higher year-over-year, marking a record for the period. At its current pace, November production is also tracking above the previous full-month November record set in 2025, although the month remains incomplete. The EIA also continues to project a new annual dry production record for the year, raising its 2026 average to 113 Bcf per day in the November 2026 STEO, an increase of 0.7 percent over the October forecast.
Domestic LNG Feedgas Continues Setting Records
U.S. LNG feedgas deliveries set a new daily record on November 7, reaching 20.3 Bcf per day, according to preliminary data from Rystad Energy. Feedgas volumes remained above 20 Bcf per day for three consecutive days through November 9 before moderating to approximately 19.6 Bcf per day on November 11. Year-to-date through November 11, feedgas deliveries have averaged 18.0 Bcf per day, 15.3 percent higher than the same period in 2025, as domestic LNG export capacity continues to expand.
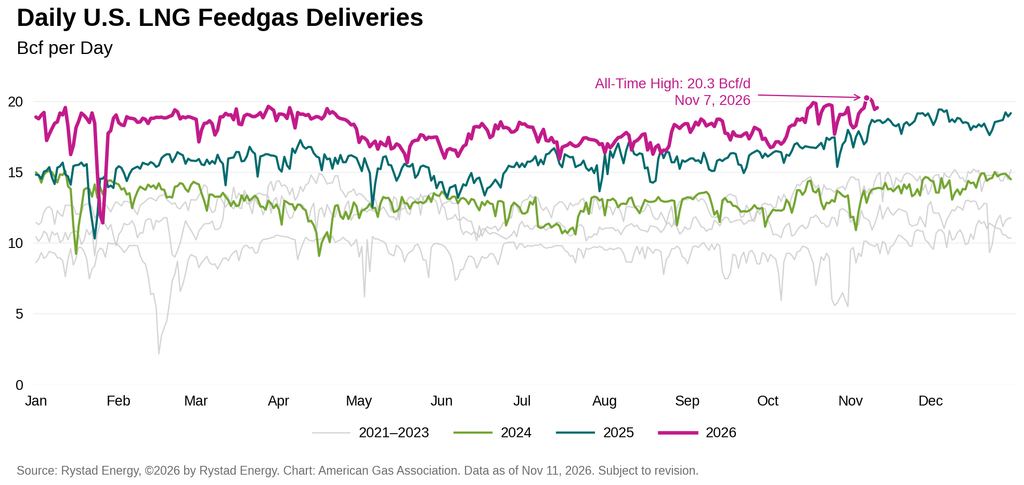
A late October outage and subsequent maintenance at Freeport weighed on deliveries, but was partially offset by rising intake at Golden Pass, according to RBN Energy. In addition, Venture Global announced that Plaquemines LNG’s first phase began commercial operations on October 31, initiating deliveries to long-term customers.
Storage Inventories Build as EIA Raises End-of-Winter Outlook
According to the EIA’s latest Weekly Natural Gas Storage Report, lower 48 working natural gas inventories increased by 77 Bcf for the week ending October 30, reaching 3,801 Bcf. Inventories stand 1.4 percent above the five-year average but remain 2.8 percent below year-ago levels. The South Central region accounted for 40 Bcf, or 52 percent, of the weekly injection, followed by the Midwest at 23 Bcf and East at 13 Bcf. Despite this increase, South Central inventories remained 1.1 percent below the five-year average, driven by lower salt cavern stores, while all other regions were above average.
Looking ahead, the EIA’s most recent forecast now projects underground natural gas storage inventories at the end of March 2027 to be 49 Bcf higher than the October STEO forecast, an increase of 2.6 percent.
Canadian Imports Rise as HDDs Increase
Cross-border natural gas pipeline flows showed mixed trends in early November, coinciding with increasing HDDs in the U.S. For the month-to-date through November 11, natural gas pipeline imports from Canada are up 8.6 percent compared to the same period in October, while pipeline exports to Mexico declined slightly by 0.6 percent, according to preliminary data from Rystad Energy. Year-to-date trends differ, however, with exports to Mexico are up 4.4 percent, while imports from Canada are down more than 12 percent.
U.S. Rig Count Edges Higher, Up 10.2 Percent Year Over Year
The U.S. drilling rig count increased by one to 604 for the week ending November 6, according to data from Baker Hughes. Oil- and natural gas-directed rigs each increased by one for the week, partially offset by a decline of one miscellaneous rig. The total rig count was 56 rigs higher than a year earlier, an increase of 10.2 percent, driven primarily by 49 additional oil-directed rigs and three additional natural gas-directed rigs.
What to Watch:
- Production: Will curtailed production reverse as heating demand builds?
- Prices: Will warmer-than-normal temperature expectations into late-November temper recent upward price movement?
- LNG: Could recovering Freeport flows and continued ramp-up at Golden Pass tighten the domestic gas balance, particularly if production remains muted as heating demand strengthens?
For questions please contact Juan Alvarado | jalvarado@aga.org, Liz Pardue | lpardue@aga.org, or Lauren Scott | lscott@aga.org
To be added to the distribution list for this report, please notify Lucy Castaneda-Land | lcastaneda-land@aga.org
Notice
In issuing and making this publication available, AGA is not undertaking to render professional or other services for or on behalf of any person or entity. Nor is AGA undertaking to perform any duty owed by any person or entity to someone else. Anyone using this document should rely on his or her own independent judgment or, as appropriate, seek the advice of a competent professional in determining the exercise of reasonable care in any given circumstances. The statements in this publication are for general information and represent an unaudited compilation of statistical information that could contain coding or processing errors. AGA makes no warranties, express or implied, nor representations about the accuracy of the information in the publication or its appropriateness for any given purpose or situation. This publication shall not be construed as including advice, guidance, or recommendations to take, or not to take, any actions or decisions regarding any matter, including, without limitation, relating to investments or the purchase or sale of any securities, shares or other assets of any kind. Should you take any such action or decision; you do so at your own risk. Information on the topics covered by this publication may be available from other sources, which the user may wish to consult for additional views or information not covered by this publication
Data Disclaimer Notice: S&P Global Energy
Reproduction of any information, data or material, including ratings (“Content”) in any form is prohibited except with the prior written permission of the relevant party. Such party, its affiliates and suppliers (“Content Providers”) do not guarantee the accuracy, adequacy, completeness, timeliness, or availability of any Content and are not responsible for any errors or omissions (negligent or otherwise), regardless of cause, or for the result obtained from the use of such Content. In no event shall Content Providers bed liable for any damages, costs, expenses, legal fees, or losses (including lost income or lost profit and opportunity costs) in connection with any use of the Content. A reference to a particular investment or security, a rating or any observation concerning an investment that is part of the Content is not a recommendation to buy, sell or hold such investment or security, does not address the suitability of an investment or security and should not be relied on as investment advice. Credit ratings are statements of opinions and are not statement of fact.
Copyright © 2026 American Gas Association. All rights reserved.Natural Gas Market Indicators – July 9, 2026