Natural Gas Market Indicators – October 16, 2026
Natural Gas Market Summary
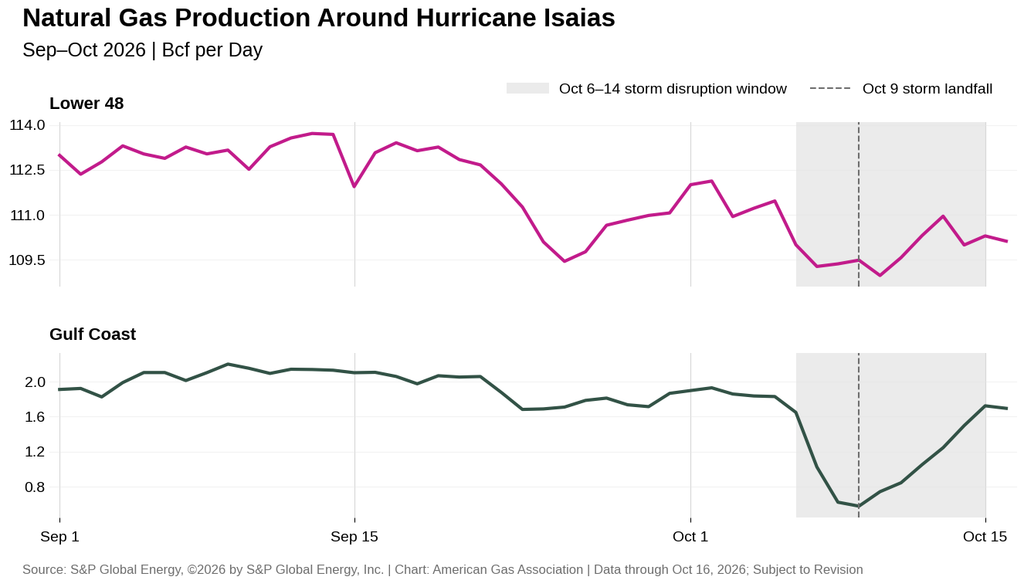
Hurricane Isaias, the first Atlantic hurricane of the 2026 season, temporarily disrupted otherwise strong U.S. natural gas supply conditions. Offshore production in the Gulf of Mexico fell sharply amid producer shut-ins ahead of the storm’s October 9 landfall and has since begun to recover. Despite the disruption, U.S. dry natural gas production remains on pace for a new annual record, helping support storage inventories. The U.S. Energy Information Administration’s (EIA) latest Short-Term Energy Outlook (STEO) projects underground storage inventories could enter the winter heating season 2 percent above the five-year average.
Against this backdrop, Henry Hub futures have fluctuated in recent weeks, with prices recovering in October after earlier declines. The November 2026 contract settled at $3.24 per MMBtu on October 15 after falling below $3.00 earlier in the month but remained below its late-September level. Despite the recent rebound, average prompt-month prices in early October were broadly comparable to those in June and below the higher levels recorded earlier this summer. The relatively comfortable U.S. supply outlook contrasts with greater uncertainty abroad, where continuing geopolitical tensions and LNG supply disruption risks are raising concerns about European gas supplies as winter approaches.
Henry Hub Prices Strengthen While Regional Trends Diverge
The Henry Hub prompt month has strengthened in October, although prices remain broadly in line with futures pricing recorded earlier this summer. The November 2026 contract settled at $3.24 per MMBtu on October 15, up 7.6 percent from its initial prompt-month settlement of $3.01 per MMBtu on September 29, but below its September 24 settlement of $3.37 per MMBtu. Month to date through October 15, November futures have averaged $3.15 per MMBtu, just 0.8 percent below the comparable prompt-month average in June. Looking at the November 2026 contract specifically, prices averaged 8.4 percent below its June level. Stronger LNG feedgas demand and a narrowing storage surplus may be supporting recent prompt month price movements, but a downward shift in November contract pricing suggests that the winter supply outlook remains strong.
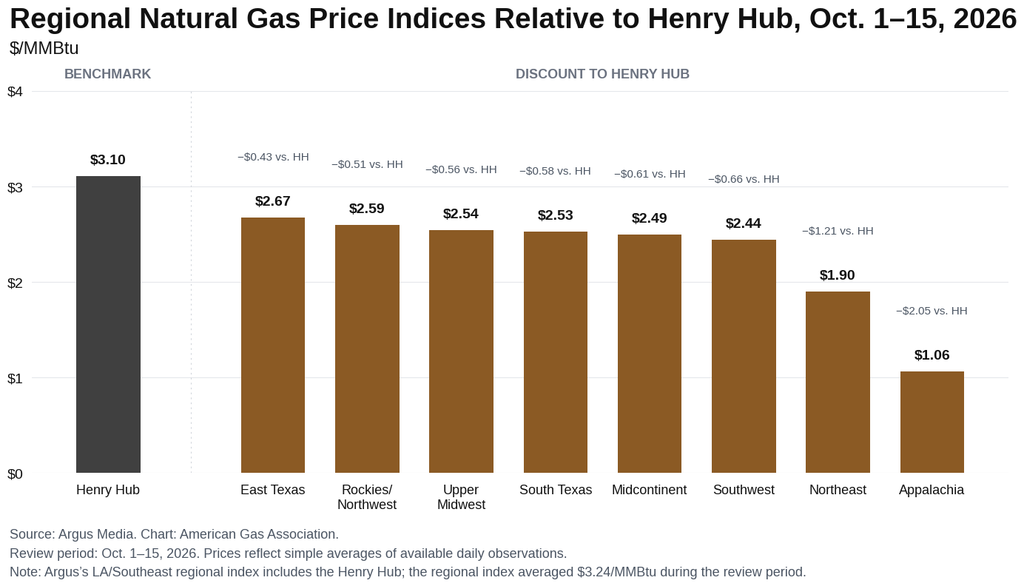
Henry Hub spot prices have also risen, averaging $3.11 per MMBtu month-to-date through October 15, up 8.4 percent from same period in September, according to Argus data. Regional price movements, however, have been mixed, with eight regional day-ahead indices declining over the same month-to-date period. Appalachia and the Northeast recorded the most pronounced declines, at 33.4 percent and 27.4 percent, respectively. As a result, the average discounts to the Henry Hub widened to $2.05 in Appalachia and $1.21 per MMBtu in the Northeast.
Above-Normal Temps Expected into Late October
The first Atlantic hurricane of the 2026 season made landfall along the Gulf Coast on Friday, October 9, bringing strong winds and heavy rain to the Southeast. Hurricane Isaias came ashore as a Category 2 storm with maximum sustained winds of 105 mph, leaving at least four dead and hundreds of thousands without power. Its remnants spawned tornadoes in North Carolina on October 11, according to the National Weather Service. At the time of this writing, the National Hurricane Center (NHC) does not expect tropical cyclone formation in the Atlantic over the next week. In the Pacific, the NHC is monitoring Hurricane Simon and Tropical Storm Trudy, both off the west coast of Mexico.
U.S. temperatures were mixed for the week ending October 10, running 3.3 percent colder than last year but more than 39 percent warmer than the 30-year normal weighted by gas home heating customers. Regionally, all areas but the Middle Atlantic, East North Central, South Atlantic, and New England were warmer than last year, while all regions were warmer than normal for the week. Into late October, the National Oceanic and Atmospheric Administration’s Climate Protection Center expects most of the U.S. to experience above-normal temperatures, with the highest probabilities in portions of the Midwest and Great Lakes, expending south into the Mississippi and Ohio valleys. Temperatures in the Rockies and Pacific are largely expected to be below- to near-normal.
Total Demand Higher Year-to-Date on Strong LNG Feedgas Volumes, Electric Power Consumption
Total U.S. natural gas demand, including exports, remains strong as the fourth quarter of 2026 begins. For the year-to-date through October 16, total demand was more than 3 percent higher year-over-year, driven by strong LNG feedgas demand and power sector consumption, according to preliminary data from S&P Global Energy. By comparison, domestic consumption has risen a modest 0.4 percent for the year to date, weighed down by softer residential and commercial sector demand.
Production Remains on Record Pace Despite Recent Dip in the Gulf
U.S. dry natural gas production remains well above year-ago levels. According to data from S&P Global Energy, year-to-date production through October 16 has averaged 4.1 percent higher than during the same period in 2025, putting 2026 on pace to set a new annual record. October month-to-date production is also 3.4 percent higher year over year, although it is 1.7 percent below the comparable period in September.
The recent decline in production coincides with Hurricane Isaias and associated offshore production shut-ins. According to S&P Global Energy, dry gas production in the Gulf of Mexico reached its lowest level during the storm on October 9, falling approximately 69 percent below the pre-storm average between September 29 and October 5. Production has since started to recover, although it remained approximately 24 percent below the pre-storm average on October 14. Similarly, the Marine Minerals Administration reported that approximately 1.26 Bcf per day, or 58.8 percent of Gulf offshore natural gas production, was shut in on October 9. In its final update on October 14, the agency reported that shut-ins had declined to 0.24 Bcf per day, or 11.1 percent, as offshore operations resume.
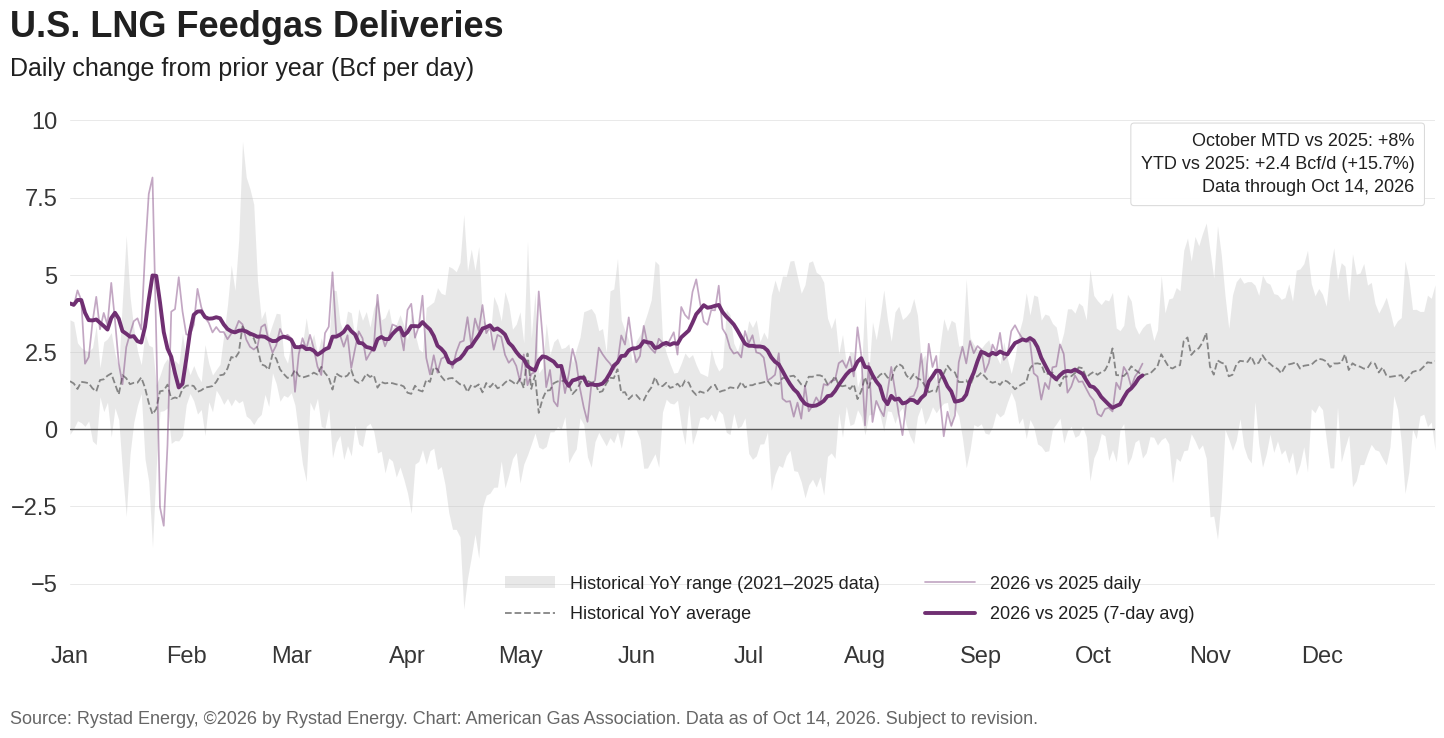
LNG Feedgas Volumes Averaging 2.4 Bcfd Higher Year to Date
Despite softer volumes in early October, domestic LNG feedgas deliveries remain robust. Feedgas volumes have averaged 2.4 Bcf per day higher year to date through October 14, a 15.7 percent increase over the same period in 2025. Deliveries remain above year-ago levels, though the gap has generally narrowed since the first half of the year. For the month to date through October 14, volumes are nearly 8 percent higher, reflecting continued growth in natural gas demand from LNG facilities.
Earlier this month, Venture Global announced a 20-year agreement to supply ConocoPhillips with 1 million metric tons of LNG annually beginning in 2030. The company also requested FERC authorization to place Phase 1 of its Plaquemines LNG facility in Louisiana into service, a step toward deliveries under long-term contracts. Venture Global is targeting October 31, 2026, for Phase 1 commercial operations and mid-2027 for Phase 2. The facility has been producing LNG and exporting commissioning cargoes since December 2024.
Storage Surplus Narrows Ahead of Winter
Total lower 48 underground storage inventories increased by 67 Bcf to 3,567 Bcf for the week ending October 9, according to the EIA’s most recent Weekly Natural Gas Storage Report. The weekly injection was 23 Bcf below the five-year average for the same week, narrowing the surplus relative to the five-year average from 2.0 percent last week to 1.3 percent.
Regionally, working gas stocks remain above their respective five-year averages across the East, Midwest, Mountain, and Pacific regions. In contrast, South Central inventories are 3.1 percent below the five-year average, with salt cavern storage showing a larger deficit of 15.4 percent. Despite these regional differences and the narrowing national surplus, total Lower 48 inventories remain within the historical five-year range as the winter withdrawal season approaches.
Pipeline Flows Mixed into Mid-October
For the month to date through October 14, Rystad Energy data indicates that natural gas imports from Canada are 5.6 percent higher than the same period in September but 4.2 percent lower than year-ago levels, amid fewer HDDs compared to last year. For the year to date, Canadian imports are down more than 12 percent. Despite running 6.1 percent lower month-over-month, exports to Mexico are 2.9 percent higher compared to October 2025 and 4.5 percent higher for the year to date.
Permian and Haynesville Lead Rig Count Gains
The U.S. drilling rig count increased by five for the week ending October 9, bringing the total number of operating rigs to 603, according to data from Baker Hughes. The week-over-week increase was driven by six additional oil-directed rigs, partially offset by a decline of one natural gas-directed rig. Regionally, the Permian Basin accounted for four additional rigs, bringing its total to 274, while the Haynesville Basin added one rig to reach 57. The two basins also recorded the largest year-over-year increases in drilling activity among major basins, gaining 24 and 16 rigs, respectively. Despite the weekly decline, the number of natural gas-directed rigs remains 12 above the same period last year.
What to Watch:
- Production: With roughly six weeks left of the 2026 Atlantic hurricane season, could unexpected weather-related shut-ins materially affect natural gas production output?
- Demand: Will power sector consumption continue to support demand as cooling needs fade?
- Infrastructure: How will additional pipeline capacity influence Permian natural gas production and regional prices?
For questions please contact Juan Alvarado | jalvarado@aga.org, Liz Pardue | lpardue@aga.org, or Lauren Scott | lscott@aga.org
To be added to the distribution list for this report, please notify Lucy Castaneda-Land | lcastaneda-land@aga.org
Notice
In issuing and making this publication available, AGA is not undertaking to render professional or other services for or on behalf of any person or entity. Nor is AGA undertaking to perform any duty owed by any person or entity to someone else. Anyone using this document should rely on his or her own independent judgment or, as appropriate, seek the advice of a competent professional in determining the exercise of reasonable care in any given circumstances. The statements in this publication are for general information and represent an unaudited compilation of statistical information that could contain coding or processing errors. AGA makes no warranties, express or implied, nor representations about the accuracy of the information in the publication or its appropriateness for any given purpose or situation. This publication shall not be construed as including advice, guidance, or recommendations to take, or not to take, any actions or decisions regarding any matter, including, without limitation, relating to investments or the purchase or sale of any securities, shares or other assets of any kind. Should you take any such action or decision; you do so at your own risk. Information on the topics covered by this publication may be available from other sources, which the user may wish to consult for additional views or information not covered by this publication
Data Disclaimer Notice: S&P Global Energy
Reproduction of any information, data or material, including ratings (“Content”) in any form is prohibited except with the prior written permission of the relevant party. Such party, its affiliates and suppliers (“Content Providers”) do not guarantee the accuracy, adequacy, completeness, timeliness, or availability of any Content and are not responsible for any errors or omissions (negligent or otherwise), regardless of cause, or for the result obtained from the use of such Content. In no event shall Content Providers bed liable for any damages, costs, expenses, legal fees, or losses (including lost income or lost profit and opportunity costs) in connection with any use of the Content. A reference to a particular investment or security, a rating or any observation concerning an investment that is part of the Content is not a recommendation to buy, sell or hold such investment or security, does not address the suitability of an investment or security and should not be relied on as investment advice. Credit ratings are statements of opinions and are not statement of fact.
Copyright © 2026 American Gas Association. All rights reserved.Natural Gas Market Indicators – July 9, 2026