Natural Gas Market Indicators – October 29, 2026
Natural Gas Market Summary
As the U.S. natural gas market approaches winter, strong production and warmer-than-normal temperatures act as bearish indicators on prices, even as export demand reaches record levels and power sector gas demand remains elevated. Winter futures have declined since summer, with the sharpest recent declines concentrated in late October as the November contract expired. On October 15, the National Oceanic and Atmospheric Administration (NOAA) released its monthly seasonal outlook, which indicated above-normal temperatures across the Northern tier through February 2027. NOAA’s near-term expectations for warmer-than-normal temperatures into early November could delay a sustained increase in heating demand.
Natural Gas Futures Trending Lower Ahead of Winter
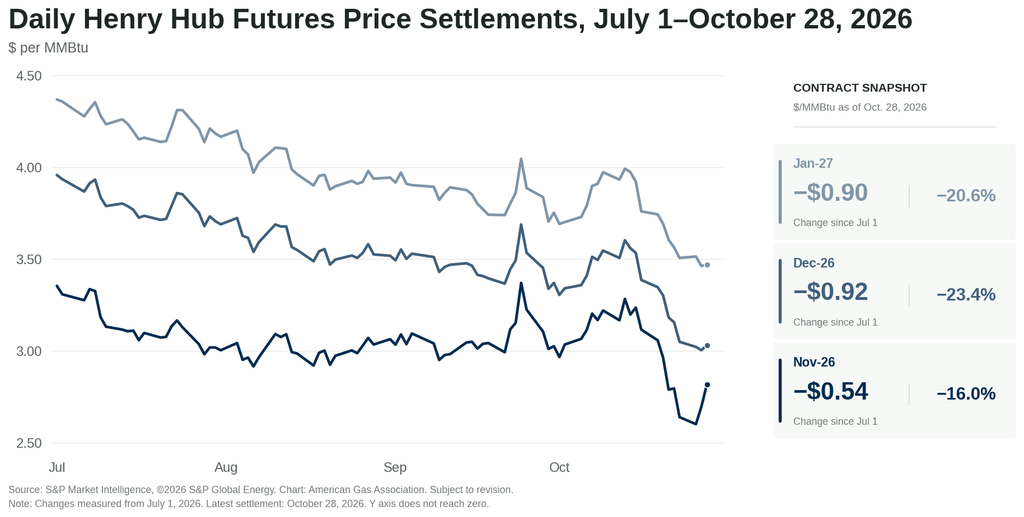
Henry Hub futures dropped ahead of the November 2026 contract expiration. After settling above $3 per MMBtu for 12 consecutive trading days—including a recent high of $3.28 on October 13—the contract fell to $2.60 on October 26. That settlement was more than 12 percent below its level on the first trading day of October and the lowest prompt month price in six months. The November contract expired at $2.82 per MMBtu on October 28, 6.4 percent lower than its first day as the prompt-month price. Intraday on October 29, the December contract was trading between $2.90 and $3.07 per MMBtu at the time of this writing.
The decline in futures prices is more pronounced when viewed over a longer period. From July 1 to expiration, the November contract fell $0.54 per MMBtu, or 16 percent. Prices for the December 2026 and January 2027 contracts have also declined, falling 23.4 percent and 20.6 percent, respectively, over the same period.
NOAA Forecasts Warmer-than-Normal Winter
For the week ending October 24, U.S. temperatures were 1.5 percent warmer than the same week last year and 17.5 percent warmer than the 30-year normal (1970-2001), according to NOAA heating degree day data weighted by natural gas home heating customers. In the East North Central, West North Central, and Mountain regions, temperatures ranged between 20.2 and 43.3 percent warmer than the same week last year. The remaining six regions experienced cooler temperatures, ranging from 1.9 percent cooler in the East South Central to 100.0 percent cooler (twice as many heating degree days) in the West South Central. Relative to the 30-year normal, temperatures were warmer across all regions except New England and the South Atlantic.
Looking ahead, above-normal temperatures are favored in both the near-term and winter outlooks. NOAA’s October 28 outlook favors higher probabilities of warmer-than-normal temperatures across most of the continental U.S. from November 5–11, particularly the northern Plains and Upper Midwest. Similarly, NOAA’s three-month seasonal outlook released October 15 shows the strong El Niño influence will favor warmer-than-normal temperatures across much of the northern U.S., with the greatest likelihood of above-normal temperatures extends across the Pacific Northwest, northern Rockies, Midwest, and much of the Northeast, while near-normal temperatures are favored across parts of the Southeast. If the forecast holds, these temperature patterns could moderate winter heating demand across several major natural gas-consuming regions, although periods of extreme cold remain possible.
At the time of this writing, NOAA’s National Hurricane Center is monitoring Tropical Storm Vance off Mexico’s Pacific coast. Vance is forecast to weaken and dissipate by October 30, although heavy rainfall could still cause flooding and mudslides in western Mexico. No tropical cyclones are currently active in the Atlantic basin, and Vance is not expected to affect major U.S. natural gas production regions.
Heating Demand Climbs as Power Sector Consumption Eases
Total natural gas demand, including feedgas and pipeline exports, is up 4.7 percent month-to-date through October 29 compared to year-ago levels, according to preliminary data from S&P Global Energy. Year-over-year gains reflect both export and domestic demand growth, which increased 7.2 percent and 3.5 percent, respectively. Across domestic sectors, consumption increased by 3.6 percent in the industrial sector and 5.3 percent in the power sector butfell 0.8 percent in the residential and commercial sector compared to October 2025.
Domestic demand is down from September, driven primarily by an 18.3 percent reduction in power sector demand, consistent with easing cooling needs as the market transitions further into the fall shoulder season. Meanwhile, residential and commercial demand rose 49.5 percent as heating needs increased, while industrial demand grew 2.9 percent.
Natural Gas Producers Achieving Higher Output
U.S. dry natural gas production remains well above year-ago levels into late October, supported by global LNG demand and strong power sector consumption. For the year to date through October 29, average output is more than 4 percent higher than year-ago levels, according to preliminary data from S&P Global Energy. Company production plans also point to continued supply growth. Reuters reports that Expand Energy, EQT, and Range Resources expect higher output in 2026 with spending at or below 2025 levels. Expand Energy’s guidance released October 27 indicates 7.45 to 7.55 Bcf per day of natural gas equivalent and approximately $3 billion in capital investment for 2026, up from 7.2 Bcf per day of natural gas equivalent last year.
Record U.S. LNG Flows, Cheniere Signs QatarEnergy Deal
U.S. LNG exports reached a record high of 19.9 Bcf per day on October 18, according to data from Rystad Energy. This 1.4 percent increase over the March 28 record coincides with continued ramping of operations at Golden Pass LNG, the return of Cove Point deliveries, and increases at Sabine Pass and Plaquemines. Ongoing conflict in the Middle East and disruptions in the Strait of Hormuz have strained global LNG supplies and contributed to high utilization of U.S. LNG export capacity.
On October 22, Cheniere Energy announced that its Sabine Pass and Corpus Christi LNG export terminals each entered into long-term sales and purchase agreements with QatarEnergy to supply a total of 4 million tons per annum of LNG between the early 2030s and 2054. The agreements are notable given Qatar’s position as a major global LNG exporter, and the ongoing disruption in the Strait of Hormuz has prompted QatarEnergy to secure long-term supplies from a competing U.S. producer.
Additional analysis from Rystad Energy estimates that the conflict in the Middle East could increase global LNG import costs by at least $39 billion in 2026, even as import volumes are projected to be 60.7 million tons lower than pre-conflict expectations. Under Rystad’s modeled disruption scenario, reduced Qatari and UAE supplies are forcing buyers to compete for replacement volumes at higher prices, pushing estimated global LNG portfolio costs to $256 billion, 18 percent above pre-conflict expectations. The impacts vary considerably by region, with Europe particularly exposed due to its greater reliance on spot purchases, while East Asia’s more diversified portfolio of long-term contracts helps limit its exposure to higher costs.
Weekly Storage Build Exceeds Five-Year Average for the First Time Since Early August
The EIA reported a net storage injection of 80 Bcf for the week ending October 23, bringing total underground storage inventories to 3,724 Bcf. The build exceeded the five-year average change for the week by 3 Bcf, ending ten consecutive weeks of below-average injections. Inventories now stand 1 percent above the five-year average but nearly 4 percent below year-ago levels.
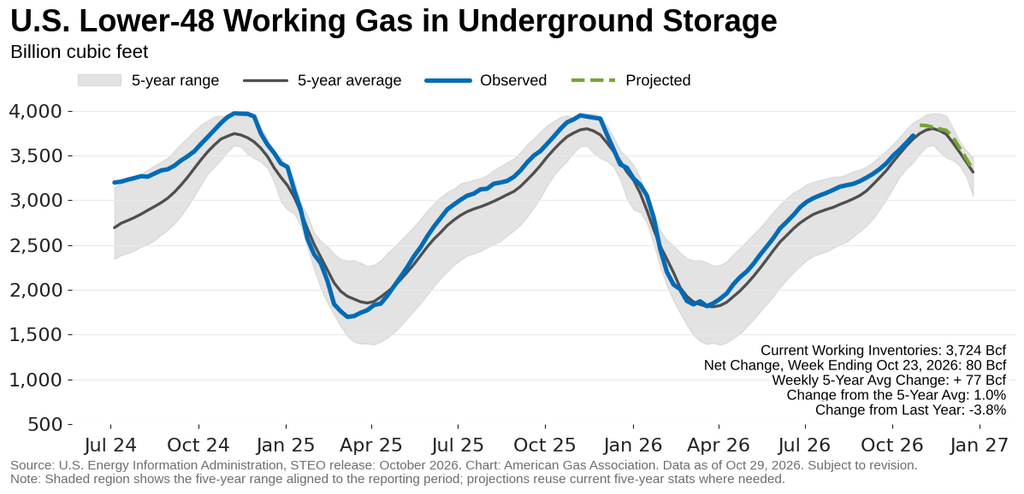
More than half of the weekly build occurred in the South Central region, where salt storage alone added 23 Bcf for the week. Despite that gain, the South Central remains the only region with inventories below its five five-year average. Only the East and Midwest hold slightly more gas than a year ago, while the Mountain region has the largest year-over-year percentage deficit of 9.5 percent.
Pipeline Exports to Mexico Set New Daily Record
U.S. natural gas pipeline exports to Mexico reached an all-time high of 7.7 Bcf per day on October 13, rising 4.4 percent over the prior record set on October 11, 2024, according to data from Rystad Energy.
Since reaching the October 13 record, pipeline exports have moderated. Preliminary data from Rystad Energy indicate that exports to Mexico averaged 6.2 Bcf per day for the week ending October 28, down 3.9 percent from last week and 4.5 percent lower than last year. Over the same period, U.S. imports from Canada averaged 3.8 Bcf per day, a 5.9 percent decline week-over-week and a 16.7 percent reduction year-over-year.
Rig Count Steady for the Week, Up Nearly 10% Year Over Year
The U.S. drilling rig count held steady at 603 for the week ending October 23, as one additional oil-directed rig offset the loss of one natural gas-directed rig, according to Baker Hughes. Total counts have gained 53 rigs from one year ago, or nearly 10 percent higher, including gains of 40 oil-directed rigs and 11 natural gas-directed rigs. The natural gas rig count was up 9.1 percent year over year.
What to Watch:
- Weather: How might periods of extreme cold affect natural gas demand and storage inventories despite expectations for a warmer-than-normal winter?
- Pipeline Trade: How could Mexico’s limited ability to withstand a prolonged interruption in U.S. natural gas imports affect broader North American energy infrastructure investment?
- LNG: What might QatarEnergy’s decision to purchase U.S. LNG signal about the growing importance of supply diversification and flexibility in global LNG markets?
For questions please contact Juan Alvarado | jalvarado@aga.org, Liz Pardue | lpardue@aga.org, or Lauren Scott | lscott@aga.org
To be added to the distribution list for this report, please notify Lucy Castaneda-Land | lcastaneda-land@aga.org
Notice
In issuing and making this publication available, AGA is not undertaking to render professional or other services for or on behalf of any person or entity. Nor is AGA undertaking to perform any duty owed by any person or entity to someone else. Anyone using this document should rely on his or her own independent judgment or, as appropriate, seek the advice of a competent professional in determining the exercise of reasonable care in any given circumstances. The statements in this publication are for general information and represent an unaudited compilation of statistical information that could contain coding or processing errors. AGA makes no warranties, express or implied, nor representations about the accuracy of the information in the publication or its appropriateness for any given purpose or situation. This publication shall not be construed as including advice, guidance, or recommendations to take, or not to take, any actions or decisions regarding any matter, including, without limitation, relating to investments or the purchase or sale of any securities, shares or other assets of any kind. Should you take any such action or decision; you do so at your own risk. Information on the topics covered by this publication may be available from other sources, which the user may wish to consult for additional views or information not covered by this publication
Data Disclaimer Notice: S&P Global Energy
Reproduction of any information, data or material, including ratings (“Content”) in any form is prohibited except with the prior written permission of the relevant party. Such party, its affiliates and suppliers (“Content Providers”) do not guarantee the accuracy, adequacy, completeness, timeliness, or availability of any Content and are not responsible for any errors or omissions (negligent or otherwise), regardless of cause, or for the result obtained from the use of such Content. In no event shall Content Providers bed liable for any damages, costs, expenses, legal fees, or losses (including lost income or lost profit and opportunity costs) in connection with any use of the Content. A reference to a particular investment or security, a rating or any observation concerning an investment that is part of the Content is not a recommendation to buy, sell or hold such investment or security, does not address the suitability of an investment or security and should not be relied on as investment advice. Credit ratings are statements of opinions and are not statement of fact.
Copyright © 2026 American Gas Association. All rights reserved.Natural Gas Market Indicators – July 9, 2026